![]() Figure 7 of
Jakobs, Mol Vis 2007;
13:933-948.
Figure 7 of
Jakobs, Mol Vis 2007;
13:933-948.
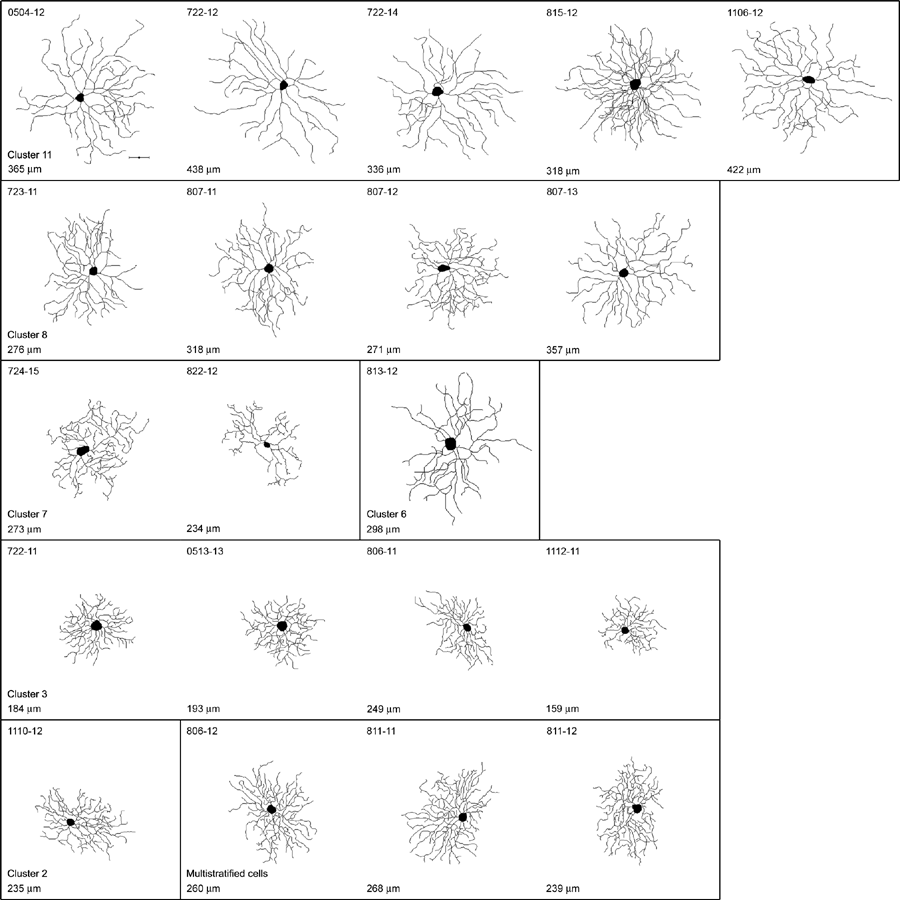
Figure 7. Tracings of 20 ganglion cells with cluster assignment
Neurolucida tracings of ganglion cells from photomicrographs. Cells falling into clusters 11 (5 cells), 8 (4 cells), 7 (2 cells), 6 (1 cell), 3 (4 cells), 2 (1 cell), and bistratified cells (3 cells) are shown. The largest dendritic field diameter is indicated for every cell. The scale bar represents 50 μm.
