![]() Figure 6 of
Jakobs, Mol Vis 2007;
13:933-948.
Figure 6 of
Jakobs, Mol Vis 2007;
13:933-948.
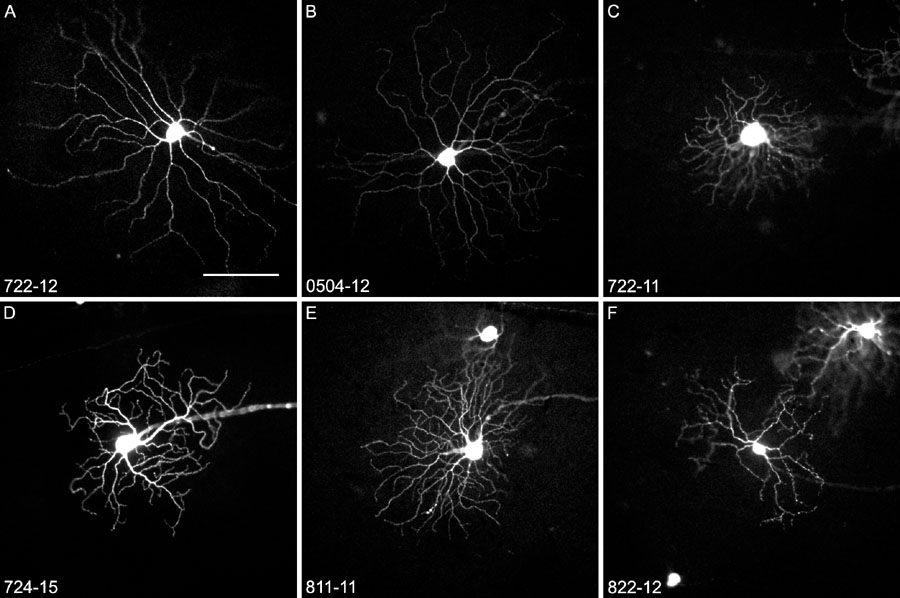
Figure 6. Gallery of ganglion cells taken for single cell analysis of their iGluR expression profile
A, B are large ON cells; C is small OFF cell; D is medium field diameter cell; E is bistratified cell; F is small OFF cell. Cell ID is indicated for every cell. Scale bar represents 100 μm.