![]() Figure 3 of
Jakobs, Mol Vis 2007;
13:933-948.
Figure 3 of
Jakobs, Mol Vis 2007;
13:933-948.
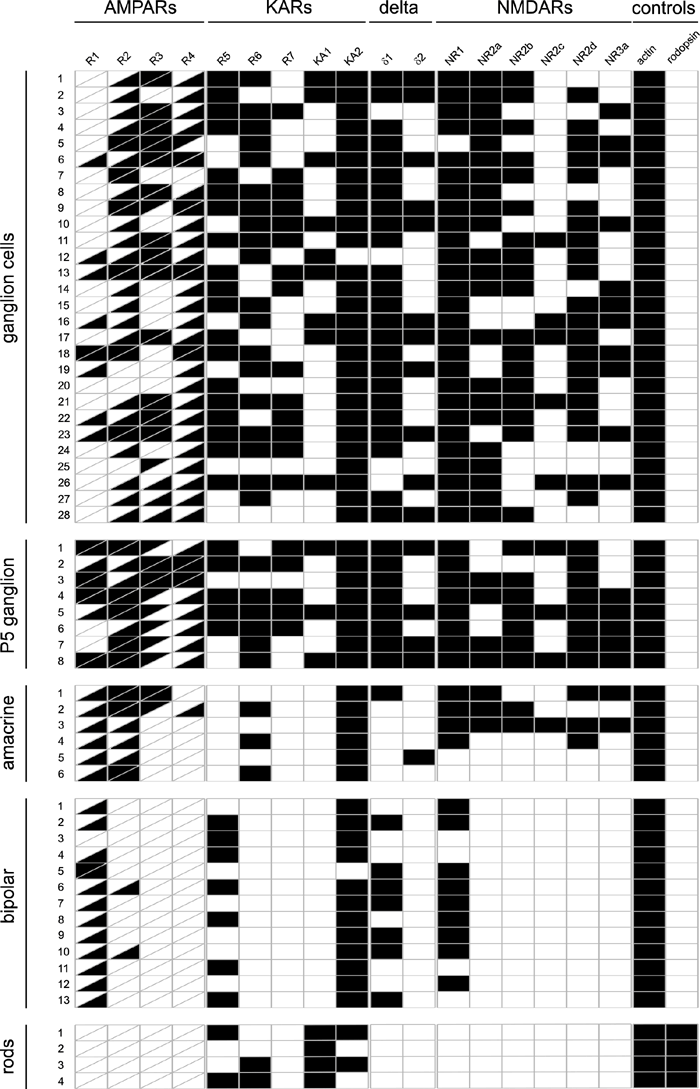
Figure 3. Ionotropic glutamate receptor expression profile in adult mouse retina
Ganglion cells, immature ganglion cells (P5), amacrine cells, bipolar cells, and rod photoreceptors were tested. Black rectangles indicate a positive polymerase chain reaction result. The rectangles for the AMPA receptors GluR1-4 are divided to indicate expression of the flip (upper left) and the flop (lower right) isoforms of these receptors.
