![]() Figure 2 of
Jakobs, Mol Vis 2007;
13:933-948.
Figure 2 of
Jakobs, Mol Vis 2007;
13:933-948.
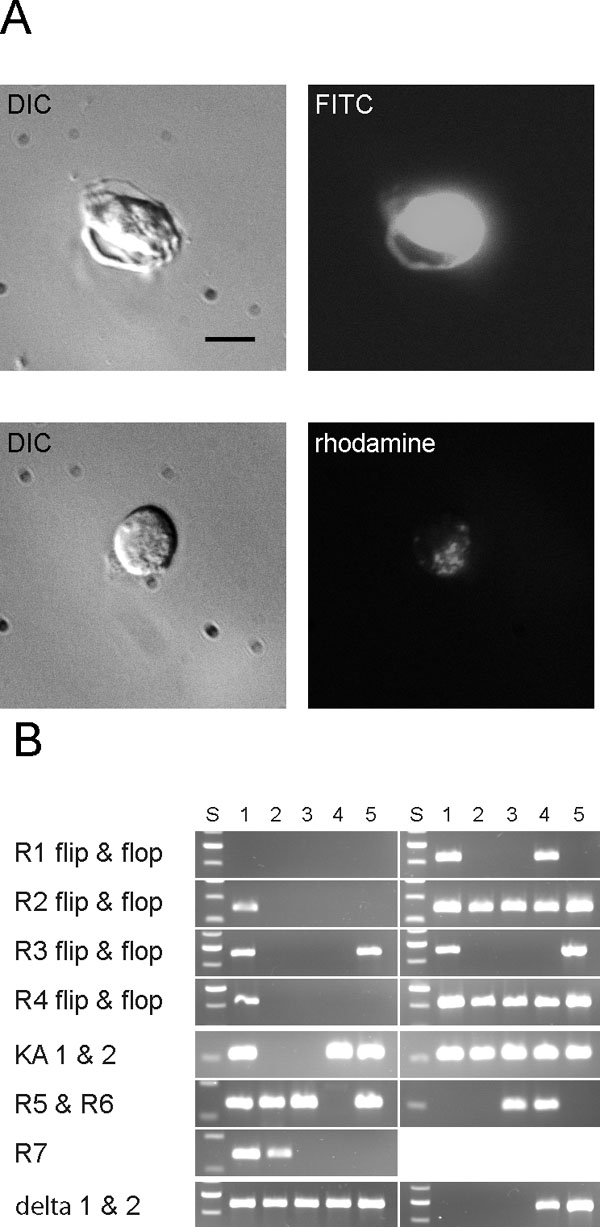
Figure 2. Isolation and reverse transcriptase polymerase chain reaction of ganglion cells
A: Ganglion cells isolated from mouse strain YFP-12, identified by their bright fluorescence (upper panels) and from C57BL identified by fluorescent inclusion bodies in the cytoplasm 2 days after injection of rhodamine-dextran into the superior colliculus (lower panels). Scale bar represents 10 μm. B: Single ganglion cells were assayed for all AMPA receptors in flip and flop isoforms, kainate receptors KA1&2 and GluR5-7, δ1 and δ2, NMDA receptors NR1, NR2a-d, and NR3a, and actin and rod-opsin as positive and negative internal controls. S= molecular weight standard (100 bp ladder), results from 5 individual ganglion cells are shown.