![]() Figure 1 of
Jakobs, Mol Vis 2007;
13:933-948.
Figure 1 of
Jakobs, Mol Vis 2007;
13:933-948.
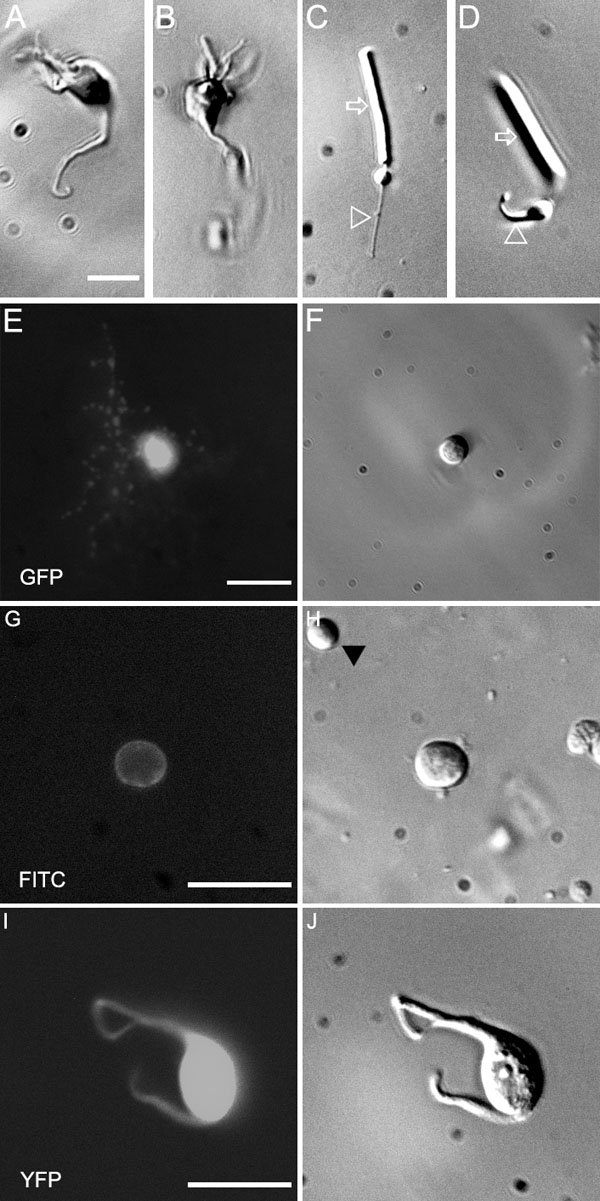
Figure 1. Isolation of retinal interneurons
A, B: Bipolar cells, easily recognizable by their morphology. C, D: Rod photoreceptors. Note the well-preserved morphology of the rod outer segment (arrows) and the axon (arrowheads). Scale bar for A-D reprsents 10 μm. E: Amacrine cell from a GFP-M retina before dissociation. The focus is on the dendrites of this small-field cell. F: The same cell after dissociation of the retinal piece. Scale bar for E and F represents 20 μm. G: CD15 amacrine cells can be directly visualized in the dissociate from C57BL retina by addition of a FITC-labeled anti-CD15 antibody. The immunofluorescence delineates the cell membrane because CD15 is an extracellular glycoprotein epitope. H: the same cell in Hoffman optics. Note that the other cell body (arrowhead) is negative for CD15. Scale bar for G and H 20 μm. I: Immature ganglion cell at P5 from an YFP-12 mouse. J: The same cell in Hoffman optics. Scale bar for I and J represents 20 μm.