![]() Figure 4 of
Brand, Mol Vis 2007;
13:920-932.
Figure 4 of
Brand, Mol Vis 2007;
13:920-932.
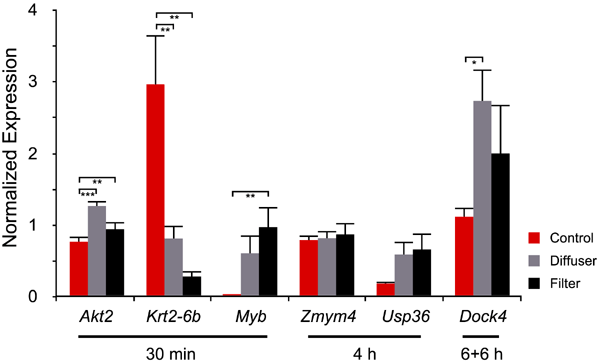
Figure 4. Retinal mRNA expression levels in untreated (control) and treated (diffuser/filter) animals
Normalized expression values were plotted on the ordinate. Error bars denote standard errors of the mean (SEM). Statistical results represent the ANOVA followed by Tukey-Kramer test. A single asterisk indicates p<0.05 *, while a double asterisk denotes p<0.01 **, and a triple asterisk marks p<0.001 ***. Three control animals and six treated animals were used in these experiments.
