![]() Figure 2 of
Brand, Mol Vis 2007;
13:920-932.
Figure 2 of
Brand, Mol Vis 2007;
13:920-932.
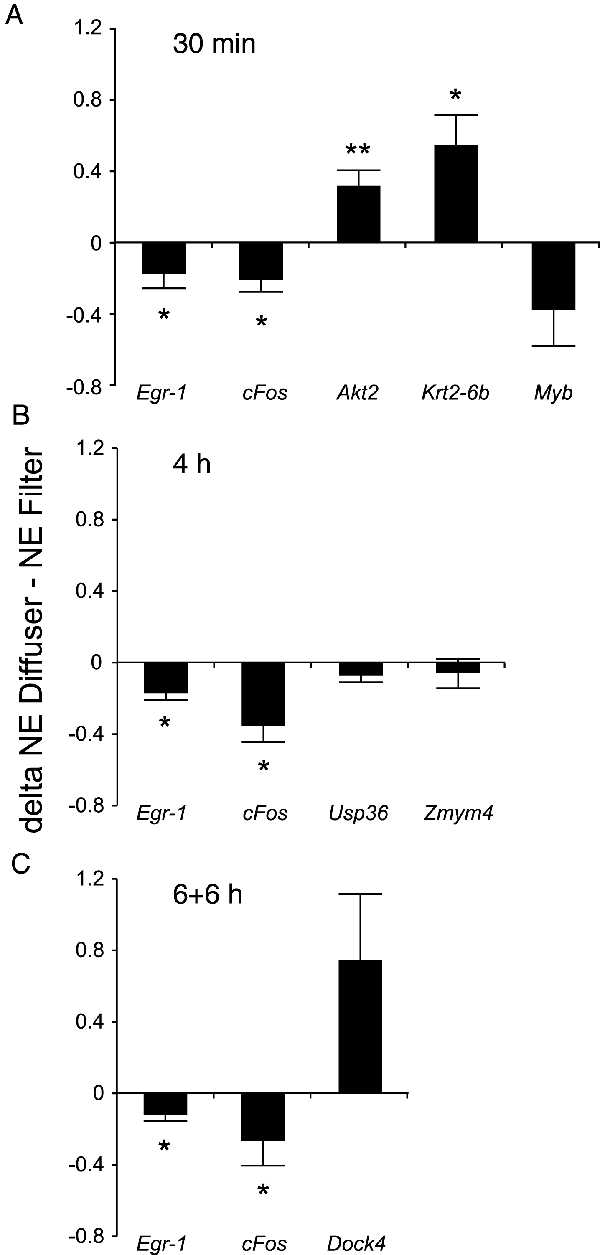
Figure 2. Analysis of GeneChip® results by real-time reverse transcriptase polymerase chain reaction
Delta values were calculated between the normalized expression values of the diffuser- and neutral density (ND) filter-treated eyes and are plotted on the ordinate. Six mice were used for each experiment. Results were given as follows for each treatment group: (A) 30 min treatment group, (B) presents 4 h group and (C) 6+6 h group. Single asterisk represents p<0.05 *; while double asterisk indicates p<0.01 **. Error bars denote standard errors of the mean.
