![]() Figure 1 of
Brand, Mol Vis 2007;
13:920-932.
Figure 1 of
Brand, Mol Vis 2007;
13:920-932.
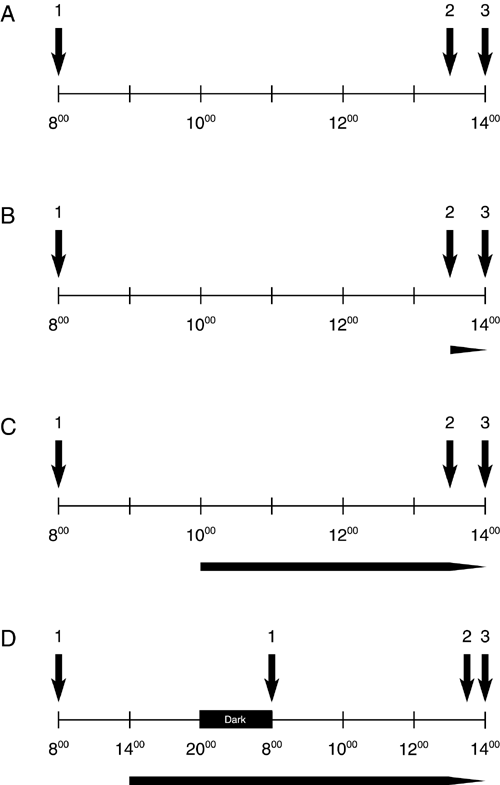
Figure 1. Detailed representation of the treatment protocol
A: shows the protocol for the control animals. A-D: An arrow above each time bar signals (1) the time when mice were brought into light, (2) when each mouse was put into the rotating drum, and (3) when mice were sacrificed. B-D: The arrows below the time bars mark the beginning of each treatment: 30 min (B), 4 h (C), and 6+6 h (D) diffuser and ND filter attachment. Three animals were treated per day, and were brought into light as follows: the first mouse at 8.00 a.m., the second at 8.30 a.m., and the third animal at 9.00 a.m. Accordingly, the entire treatment schedule was shifted 30 min or 1 h later (to the right) for the 2nd and 3rd animals, respectively.