![]() Figure 12 of
Johnson, Mol Vis 2007;
13:887-919.
Figure 12 of
Johnson, Mol Vis 2007;
13:887-919.
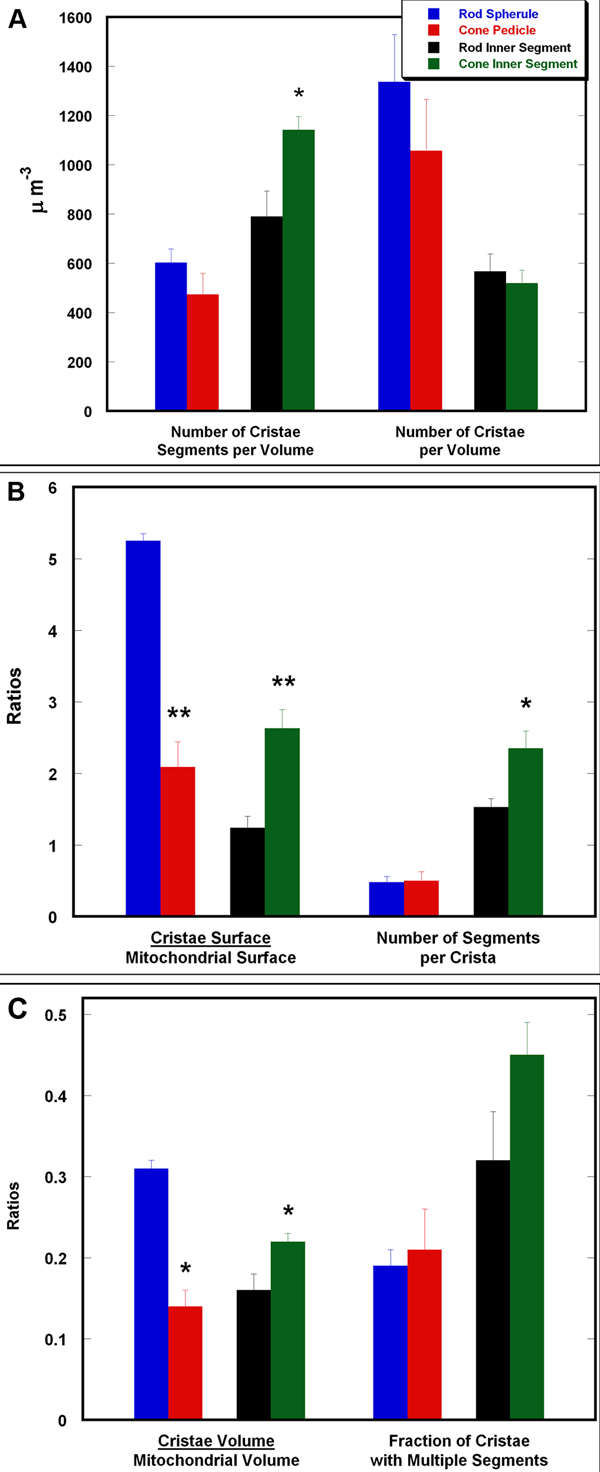
Figure 12. Cristae measurements of rod spherule and cone pedicle mitochondria obtained from tomographic reconstructions
A-C: Comparison of cristae measurements in rod and cone synaptic terminal and inner segment mitochondria. The reconstructed portion of the mitochondrion was segmented along membranes: outer membrane, inner boundary membrane and cristae membranes. The programs Synuarea and Synuvolume calculated the volume and surface area values for the outer membrane (used for "mito" in the denominator) and each crista. The values for individual cristae were summed to provide the number per volume (A) or numerator of the ratios (B and C). The mean values (±SEMs) for mitochondria in rod spherules (blue bars) and cone pedicles (red bars) are presented in each plot. In addition, our previously published mean (±SEMs) values for rod inner segment (black bars) and cone inner segment (green bars) mitochondria are plotted for ease of comparison [55]. Measurements were conducted on the tomographic reconstructions from three rods and three cones from three different mice. A two-tailed Student's t-test determined significant differences: *p<0.05; **p<0.01.
