![]() Figure 2 of
Lopez-Martinez, Mol Vis 2007;
13:862-872.
Figure 2 of
Lopez-Martinez, Mol Vis 2007;
13:862-872.
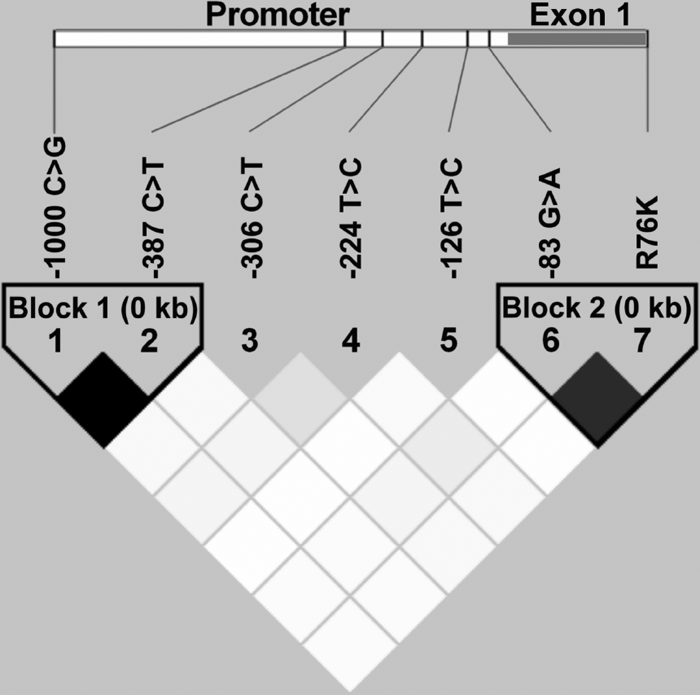
Figure 2. Pairwise linkage disequilibrium pattern of myocilin single nucleotide polymorphisms measured by D'
The location of each tested SNP along the MYOC gene is indicated at the top. The strength of LD is depicted by grey intensity, which moves from light grey to black as D' progresses from 0 to 1.
