![]() Figure 4 of
Liu, Mol Vis 2007;
13:854-861.
Figure 4 of
Liu, Mol Vis 2007;
13:854-861.
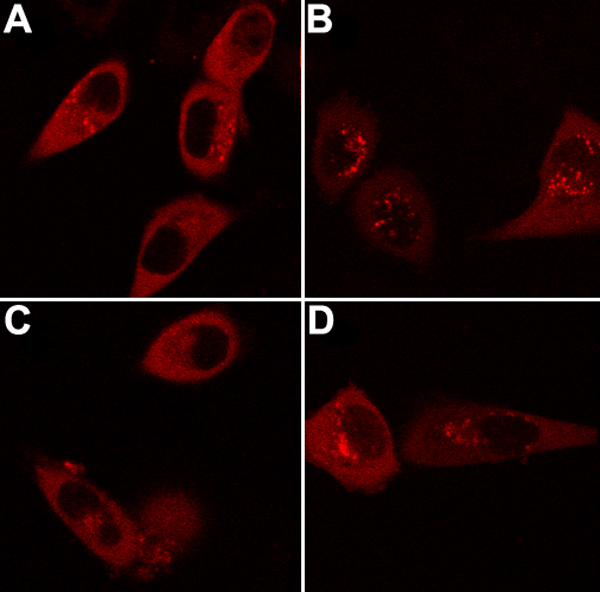
Figure 4. Representative laser scanning microscopy images of cells transfected or cotransfected with αA- and αB-crystallin genes
A: RED-αB-, B: RED-αBM-, C: GFP-αA- and RED-αB-, and D: GFP-αA- and RED-αBM-crystallin. Only images of the RED channel were shown. Constructs were transfected to HeLa cells. After culture, laser scanning microscope images were taken. The data show that cells transfected with αBM-crystallin were more susceptible to form protein aggregates than cells transfected with WT αB-crystallin and cotransfection with αA-crystallin could not reduce cells of protein aggregates for αBM-crystallin as much as for WT αB-crystallin.