![]() Figure 3 of
Liu, Mol Vis 2007;
13:854-861.
Figure 3 of
Liu, Mol Vis 2007;
13:854-861.
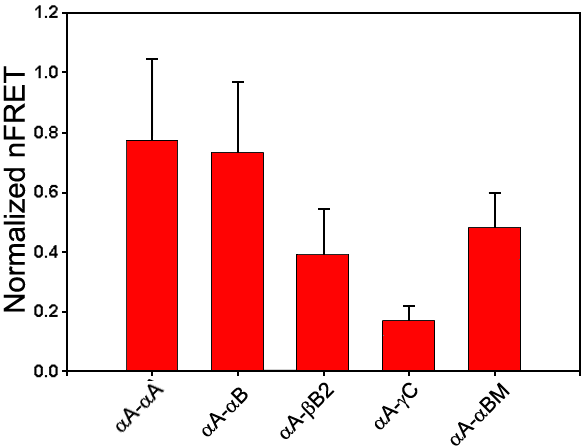
Figure 3. The quantitative normalized fluorescence resonance energy transfer values of crystallins were calculated from laser scanning microscope fluorescence resonance energy transfer images
The nFRET values are the average of regions of interests (ROIs; n=60-90) in three transfection experiments. ROIs were chosen in the areas that contain no protein aggregates. Significant differences were observed for the pairs (αA- or αB- and βB2-crystallin), (αA- or αB- and γC-crystallin), (βB2- and γC-crystallin), and (αB- and R120G αB-crystallin. The asterisk indicates a p<0.001), but insignificant for the pair (αA- and αB-crystallin; p=0.2).
