![]() Figure 2 of
Liu, Mol Vis 2007;
13:854-861.
Figure 2 of
Liu, Mol Vis 2007;
13:854-861.
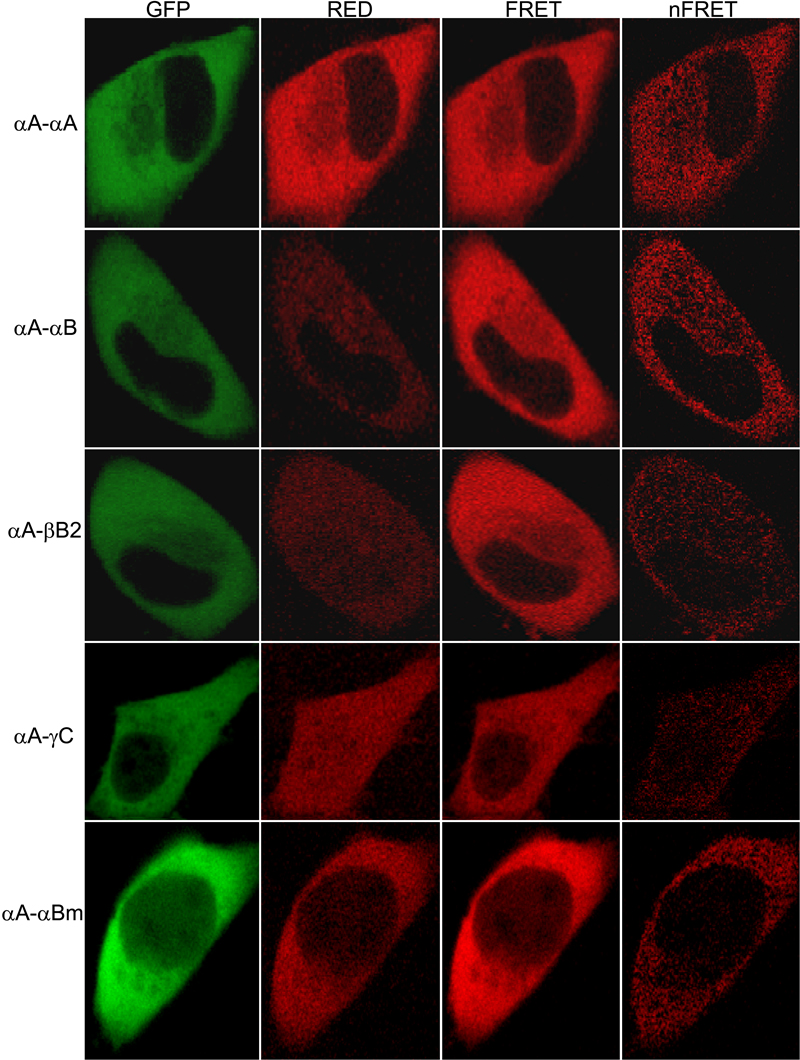
Figure 2. Representative laser scanning microscope fluorescence resonance energy transfer images of cells expressing the GFP and RED constructs
GFP-αA-crystallin as a donor and RED-crystallin (αA-, αB-, βB2-, γC-, and R120G αB-crystallin) as an acceptor. Shown on the top of the columns are various channels and normalized FRET and on the left are GFP-crystallin (donor) and RED-crystallin (acceptor) pairs. Paired constructs were cotransfected to HeLa cells. After culture, laser scanning microscope FRET images were taken. The data show that FRET is greater between αA- and αB-crystallin than between αA- and βB2- or γC-crystallin.