![]() Figure 1 of
Liu, Mol Vis 2007;
13:854-861.
Figure 1 of
Liu, Mol Vis 2007;
13:854-861.
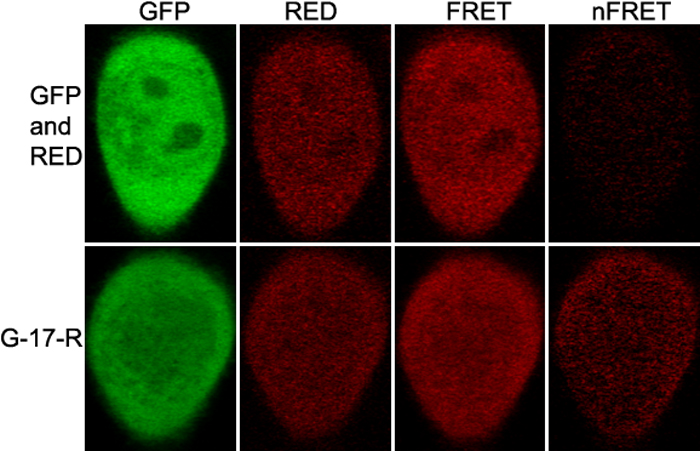
Figure 1. Laser scanning microscope fluorescence resonance energy transfer images of cells expressing either the control G-17-R or negative control
Shown on the top of the columns are various channels and normalized FRET and on the left are RED acceptors. Either the G-17-R construct or the paired constructs (GFP and RED) were transfected to HeLa cells. After culture, laser scanning microscope FRET images were acquired. The images show that normalized FRET is great for G-17-R transfected cells but very faint for (GFP and RED) cotransfected cells.