![]() Figure 3 of
Danciger, Mol Vis 2007;
13:79-85.
Figure 3 of
Danciger, Mol Vis 2007;
13:79-85.
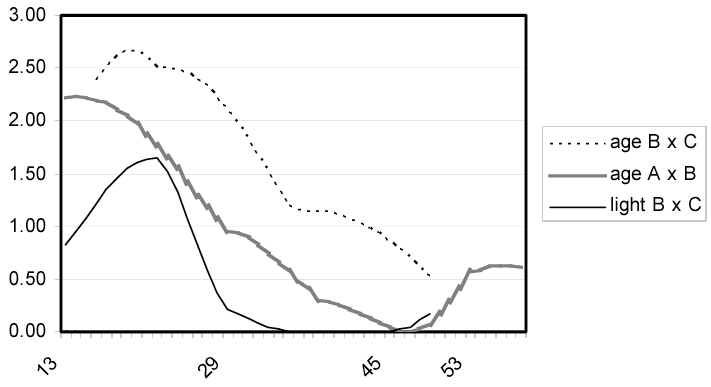
Figure 3. A quantitative trait locus on proximal Chr 12 is present in three different studies
Comparison of proximal Chr 12 quantitative trait loci (QTL) from, the B x C age-related retinal degeneration (ageRD) study [6], this A x B ageRD study and the B x C light damage study [18]. The Y axis is the LOD score and the numbers listed on the X axis are the cM positions on Chr 12.
