![]() Figure 2 of
Danciger, Mol Vis 2007;
13:79-85.
Figure 2 of
Danciger, Mol Vis 2007;
13:79-85.
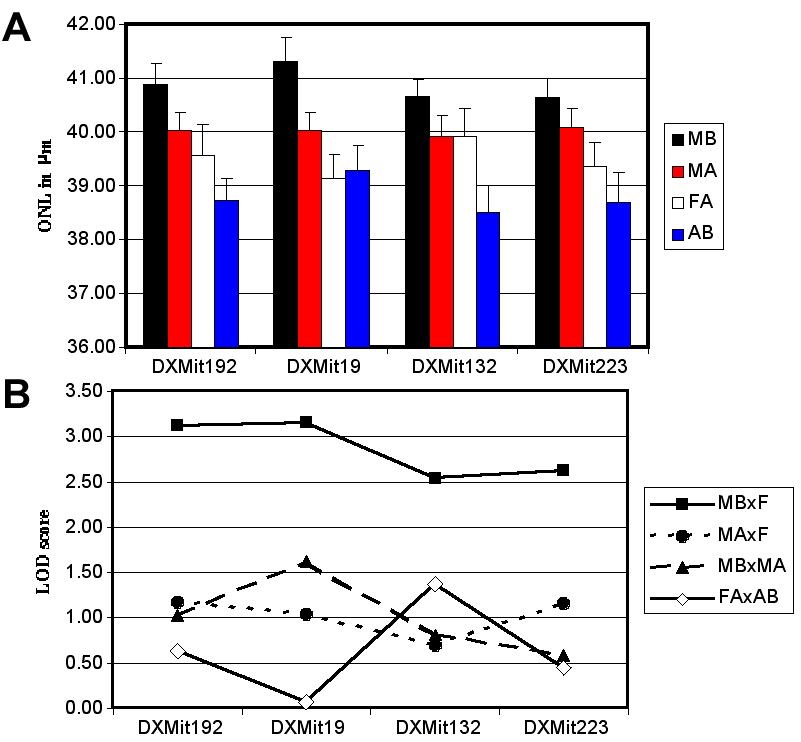
Figure 2. Comparison of average outer nuclear layer thickness scores of F2 progeny by genotype for dinucleotide repeat markers on the X chromosome
MB represents males hemizygous for the B allele; MA represents males hemizygous for the A allele; FA represents females homozygous for the A allele; AB = heterozygous females; F represents all females. A: Histogram of mean outer nuclear layer (ONL) thickness±SEM by genotype. B: Plots of the negative logarithm of the probability of significant difference determined by the unpaired Student's t-test between mean ONL thickness values of males and females of the same genotype for all four X chromosome markers. The markers are evenly spaced in the figure. The spacing does not represent true cM distances along Chr X.
