![]() Figure 1 of
Harris, Mol Vis 2007;
13:785-796.
Figure 1 of
Harris, Mol Vis 2007;
13:785-796.
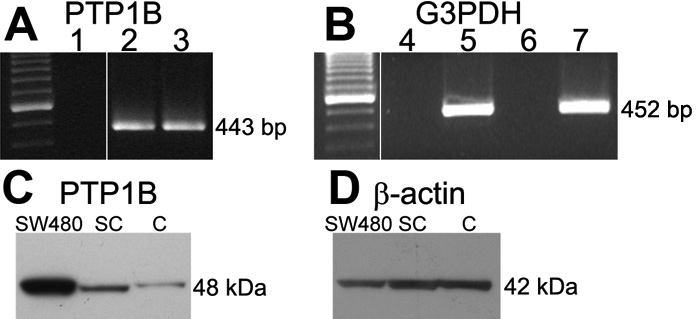
Figure 1. Representative results comparing PTP1B mRNA and protein expression in confluent and subconfluent rat corneal endothelial cells
A: RT-PCR for PTP1B. At left are molecular weight markers in 100 bp increments with the brightest band at 600 bp. Lane 1: Control sample containing all reagents, but without cDNA; Lane 2: cDNA extracted from confluent cells; Lane 3: cDNA extracted from subconfluent cells. Position of 443 bp band for PTP1B is indicated. B: RT-PCR for G3PDH control. At left are molecular weight markers; Lane 4: Control sample containing total RNA extracted from confluent cells; Lane 5: cDNA extracted from confluent cells; Lane 6: Control sample containing total RNA extracted from subconfluent cells; Lane 7: cDNA extracted from subconfluent cells. Position of 452 bp G3PDH band is indicated. C: Western blot for PTP1B (48 kDa) showing position of PTP1B in control SW480 cells and relative expression of PTP1B in subconfluent (SC) and confluent (C) rat corneal endothelial cells. D: Same membrane as in (C) reprobed for β-actin to control for protein load.