![]() Figure 4 of
Suzuki, Mol Vis 2007;
13:772-778.
Figure 4 of
Suzuki, Mol Vis 2007;
13:772-778.
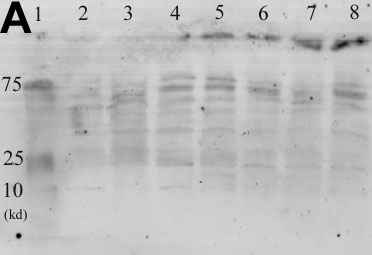
Figure 4. Comparison of the level of the oxidized phospholipids using Western blot analysis with 25 μg of proteins of the samples from normal donor eyes of different ages
A: Several bands that probably represent phospholipids containing oxidized phosphatidylcholines can be seen. The intensity of the bands increases with age. Lane 1 is the: molecular weight marker, lanes 2-8: samples from donors aged 17, 20, 35, 68, 74, 83, and 98 years old, respectively. B: Densitometric measurements of the FOH1a/DLH3 immunoreactivity. A significant correlation can be seen between age and the density of staining (r=0.89).