![]() Figure 3 of
Geller, Mol Vis 2007;
13:730-739.
Figure 3 of
Geller, Mol Vis 2007;
13:730-739.
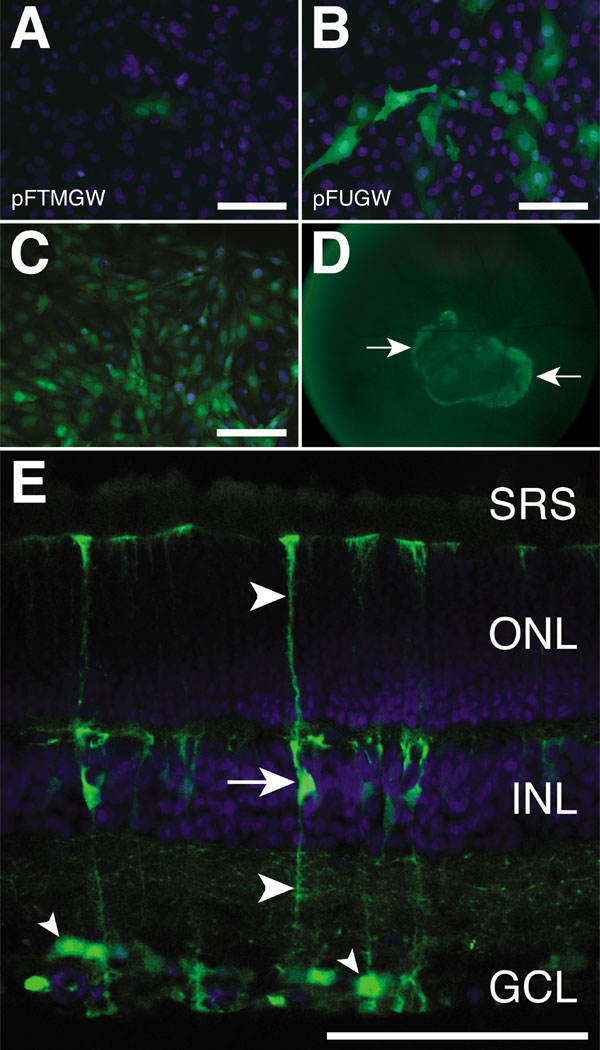
Figure 3. Microscopic evaluation of eGFP expression in Müller cells
A: Müller cells transfected with 2 μg of the modified LV transfer vector (pFTMGW) for 24 h. B: Müller cells transfected with 2 μg of the parent pFUGW plasmid for 24 h. Note the reduction in eGFP expression when the TB and MCS elements are introduced. C: Cultured Müller cells infected with the Vim409 virus expressing eGFP. D: An adolescent SD rat injected subretinally with 3 μl of the Vim409 virus. Shown here is an in vivo fluorescent fundus photograph of an eye, 5 days after injection. Arrows denote the area of viral infection and consequent eGFP expression. E: The eye shown in D was removed and processed for confocal microscopy. Shown here is a confocal image of a retinal cross-section, 5 days following infection with the Vim409 virus. The arrow indicates eGFP expression in Müller cell bodies, and large arrowheads identify the characteristic Müller cell processes that span the thickness of the neural retina. The small arrowheads indicate astrocytes in the ganglion cell layer (GCL), the other predominant glial cell type in the retina, which also express vimentin. SRS, subretinal space; ONL represents outer nuclear layer; INL represents inner nuclear layer. Scale bars in A, B, C, and E represent 100 μm.