![]() Figure 6 of
Weaver, Mol Vis 2007;
13:707-718.
Figure 6 of
Weaver, Mol Vis 2007;
13:707-718.
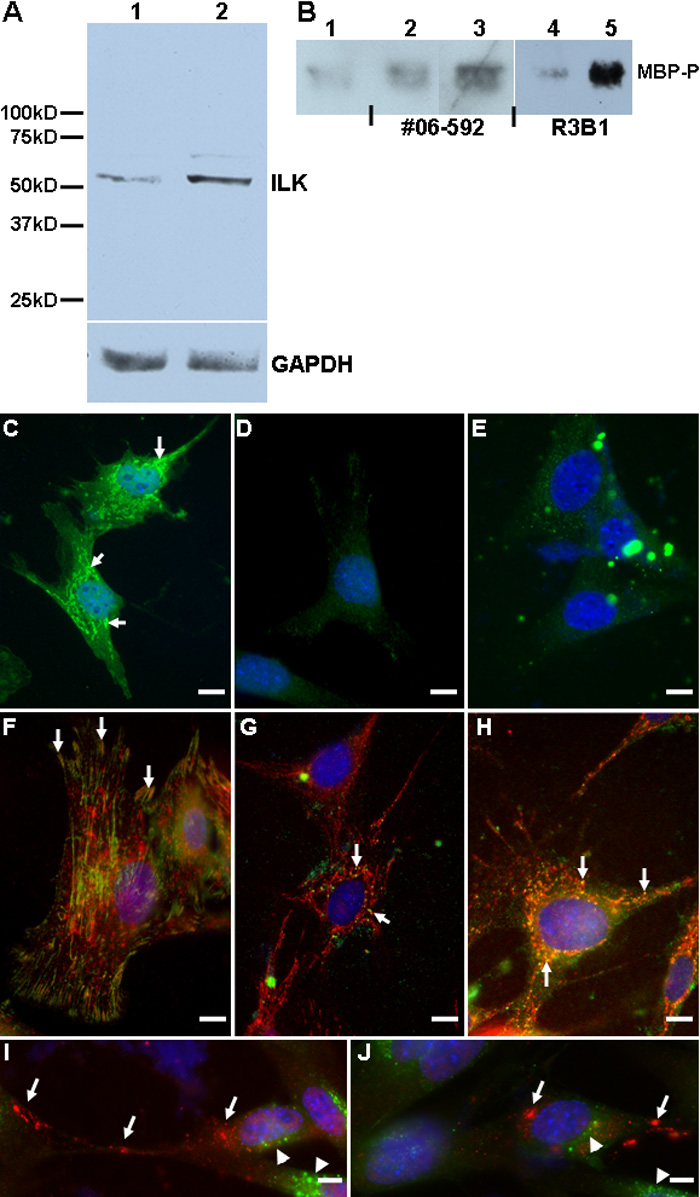
Figure 6. Production and localization of ILK in cultured mouse LEC
A: Immunoblot of lysates (20 μg/lane) from resting (lane 1) and serum-deprived cultured LEC (lane 2). Additional probe for GAPDH is shown as a protein loading control. Molecular weight standards are indicated at left. B: Immunoblot of phosphorylated MBP (MBP-P) following immunoprecipitation of ILK with commercial (#06-592) or R3B1 polyclonal antibodies, followed by in vitro kinase assay. C: Immunocytochemistry with affinity-purified anti-ILK IgG (R3B1) of LEC plated on glass coverslips; arrows indicate ILK. FITC-conjugated donkey anti-rabbit IgG was used as a secondary antibody. D: Staining performed with rabbit IgG control. E: Staining with R3B1 antibody preincubated with 10 mu g/ml rhILK. F: Staining with R3B1 (red) and anti-β1 integrin antibody (green). Yellow indicates coincidence of staining (arrows). G: Staining of cells with R3B1 (red) and anti-α5β1 integrin antibody (green). H: Staining with R3B1 (red) and anti-α5β1 integrin antibody (green) of cells plated on glass coverslips coated with 10 μg/ml fibronectin. Arrows in G and H indicate coincidence of staining. I-J: Staining with R3B1 (red) and anti-EEA1 antibody (green). Arrows indicate ILK; arrowheads indicate EEA1. The scale bar is equal to 1 μm.