![]() Figure 5 of
Andrieu-Soler, Mol Vis 2007;
13:692-706.
Figure 5 of
Andrieu-Soler, Mol Vis 2007;
13:692-706.
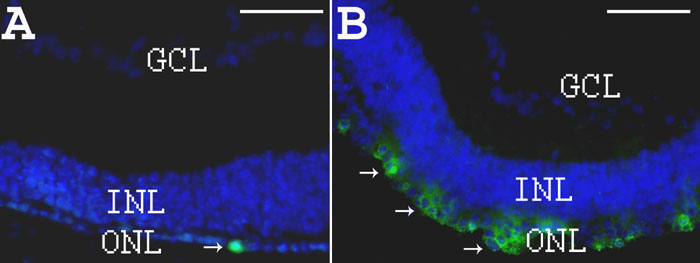
Figure 5. Rhodopsin immunohistochemistry on eye sections from PBS- or oligonucleotide-treated rd1 mice at PN28
A: DAPI staining in blue and rho-4D2 immunostaining in green (arrows) on section from PN28 PBS-treated rd1 retina. B: DAPI staining in blue and rho-4D2 immunostaining in green (arrows) on section from PN28 ODN-treated rd1 retina. Scale bars are A and B, 150 μm.