![]() Figure 1 of
Kumar, Mol Vis 2007;
13:667-676.
Figure 1 of
Kumar, Mol Vis 2007;
13:667-676.
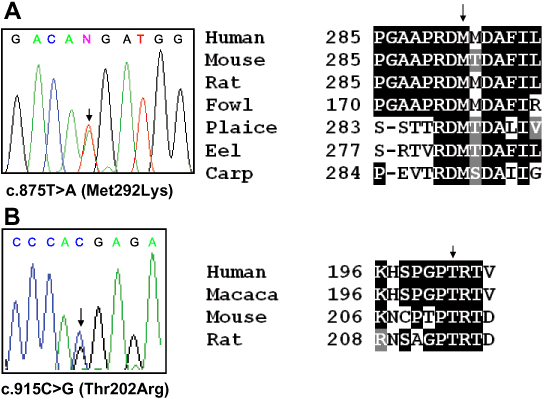
Figure 1. Mutation analysis of the CYP1B1 and OPTN genes
A: The left panel shows a sequencing chromatogram from patient 119 who had a novel mutation c.875T>A (Met292Lys) in exon 2 of CYP1B1, and the right panel shows conservation of the methionine residue across species. B: The left panel presents a sequencing chromatogram from patient 30 who had a novel mutation c.915C>G (Thr202Arg) in exon 7 of OPTN, and the right panel shows conservation of the threonine residue across species. Arrows mark positions of nucleotide changes and conserved amino acid residues.
