![]() Figure 2 of
Joko, Mol Vis 2007;
13:649-658.
Figure 2 of
Joko, Mol Vis 2007;
13:649-658.
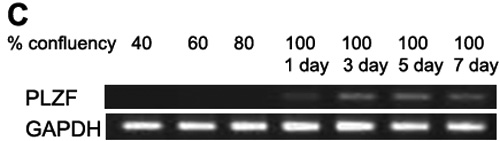
Figure 2. Kinetics of mRNA of PLZF in primary cultured HCECs
A: Cell number in 6 well plates for each condition. B: Time course of the expression of PLZF mRNA in cultured HCECs. Cultured HCECs were collected at 40%, 60%, 80%, and 100% (1 day, 3 days, 5 days, and 7 days after reached confluency). The relative expression of PLZF mRNA was determined by real-time PCR, and the amount of each mRNA was calculated relative to the amount of GAPDH mRNA in the same sample (n=3 each). The ratio of the sample from 100%/1 day was set to "1". C: Ethidium-bromide-stained agarose gels showing PCR (40 cycles) products for PLZF and GAPDH.