![]() Figure 4 of
Spence, Mol Vis 2007;
13:57-65.
Figure 4 of
Spence, Mol Vis 2007;
13:57-65.
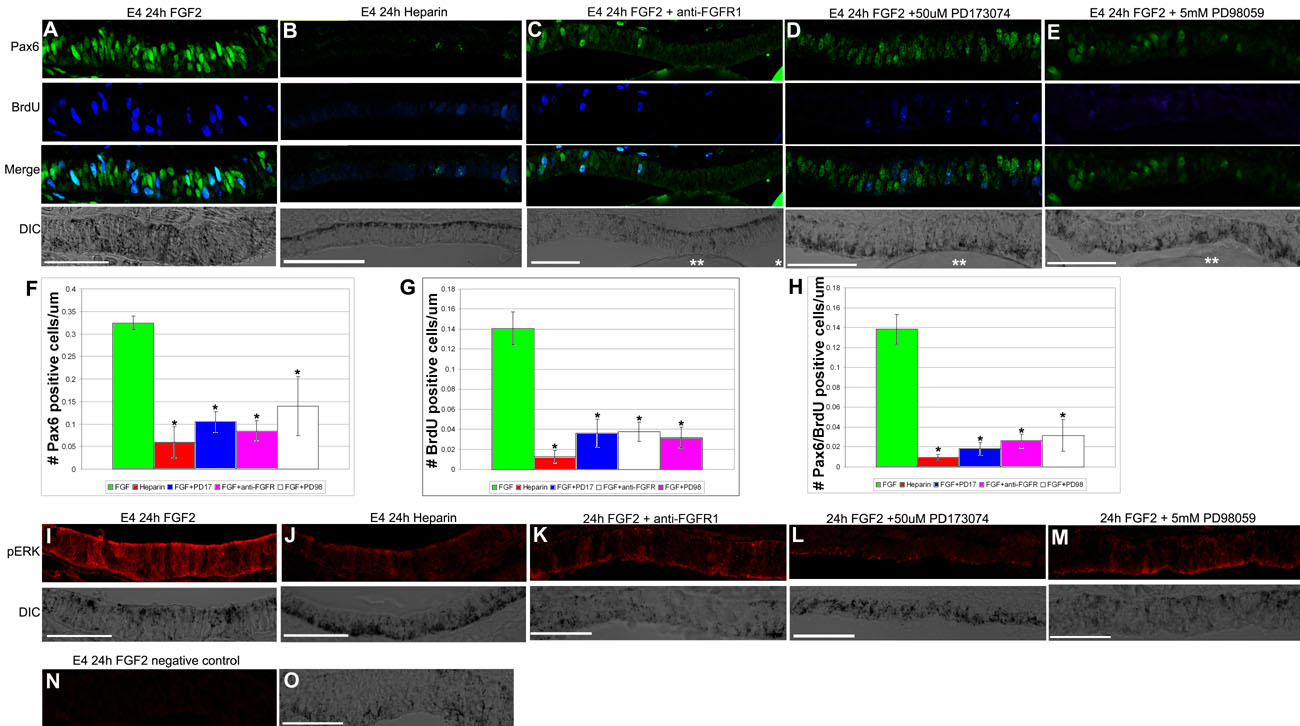
Figure 4. Pax6 and BrdU incorporation increase in response to FGF2 after retina removal at E4
A: Expression of Pax6 (top), BrdU (second), Pax6 and BrdU, Merge (third), and the DIC image (bottom) of the RPE after retina removal at E4 and 24 h of exposure to FGF2. B: Expression of Pax6 (top), BrdU (second), Pax6 and BrdU Merge (third) and the DIC image (bottom) of the RPE after retina removal at E4 and after 24 h of exposure to a heparin control bead. C: Expression of Pax6 (top), BrdU (second), Pax6 and BrdU Merge (third), and the DIC image (bottom) of the RPE after retina removal at E4 and after 24 h of exposure to FGF2 and FGFR1/FGFR2 blocking antibodies. D: Expression of Pax6 (top), BrdU (second), Pax6 and BrdU Merge (third), and the DIC image (bottom) of the RPE after retina removal at E4 and after 24 h of exposure to FGF2 and the FGFR inhibitor PD173074. E: Expression of Pax6 (top), BrdU (second), Pax6 and BrdU Merge (third) and the DIC image (bottom) of the RPE after retina removal at E4 and after 24 h of exposure to FGF2 and the MEK inhibitor PD98059. F: The number of Pax6-positive cells per μm of RPE in treatments shown in A-E was quantitated. The number of Pax6 positive cells was significantly reduced in all treatments compared to FGF alone. *p<0.01. G: The number of BrdU-positive cells per μm of RPE in treatments shown in A-E was quantitated. The number of BrdU positive cells was significantly reduced in all treatments compared to FGF alone. *p<0.01. H: The number of Pax6/BrdU positive cells per um of RPE in treatments shown in A-E was quantitated. The number of Pax6/BrdU positive cells was significantly reduced in all treatments compared to FGF alone. *p<0.01. I: Erk phosphorylation in the RPE after retina removal at E4 and after 24 h of exposure to FGF2 (top) and DIC image of the RPE (bottom). J: Erk phosphorylation in the RPE after retina removal at E4 and after 24 h of exposure to heparin (top) and DIC image of the RPE (bottom). K: Erk phosphorylation in the RPE after retina removal at E4 and after 24 h of exposure to FGF2 plus FGFR1/FGFR2-blocking antibodies (top) and DIC image of the RPE (bottom). L: Erk phosphorylation in the RPE after retina removal at E4 and after 24 h of exposure to FGF2 and the FGFR inhibitor PD173074 (top) and DIC image of the RPE (bottom). M: Erk phosphorylation in the RPE after retina removal at E4 and after 24 h of exposure to FGF2 plus the MEK inhibitor PD98059 (top) and DIC image of the RPE (bottom). N: Negative control for the immunostaining in panels I-M. O: DIC image of N. Scale bars represent 50 μm; ** represents FGF2 bead in C-E.