![]() Figure 3 of
Spence, Mol Vis 2007;
13:57-65.
Figure 3 of
Spence, Mol Vis 2007;
13:57-65.
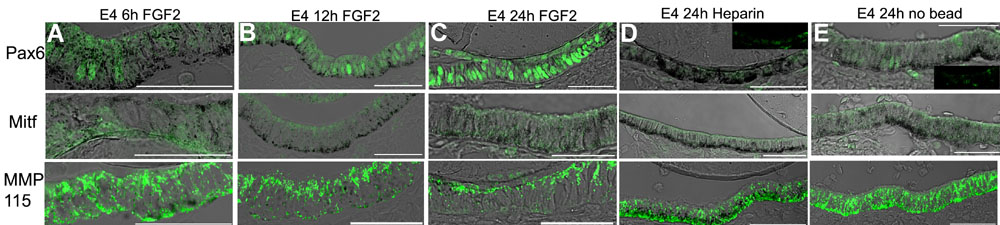
Figure 3. FGF2 stimulates Pax6 expression in the retinal pigment epithelium when the retina is removed at E4
A: Expression of Pax6 (top), Mitf (middle), and MMP115 (bottom) after retina removal at E4 and in response to 6 h of exposure to FGF2. B: Expression of Pax6 (top), Mitf (middle), and MMP115 (bottom) after retina removal at E4 and in response to 12 h of exposure to FGF2. C: Expression of Pax6 (top), Mitf (middle), and MMP115 (bottom) after retina removal at E4 and in response to 24 h of exposure to FGF2. D: Expression of Pax6 (top), Mitf (middle), and MMP115 (bottom) after retina removal at E4 and in response to 24 h of exposure to a heparin bead. Inset image shows Pax6 expression without DIC overlay. Note that few cells are Pax6 positive. E: Expression of Pax6 (top), Mitf (middle), and MMP115 (bottom) after retina removal at E4 with no bead and visualized 24 h post-retinectomy. Inset image shows Pax6 expression without DIC overlay. Note that Pax6 levels in no-bead and heparin bead controls are significantly lower than those treated with FGF2. Scale bars represent 50 μm. A was taken at a closer magnification than that of B-E (see scale bars).