![]() Figure 7 of
Kowluru, Mol Vis 2007;
13:602-610.
Figure 7 of
Kowluru, Mol Vis 2007;
13:602-610.
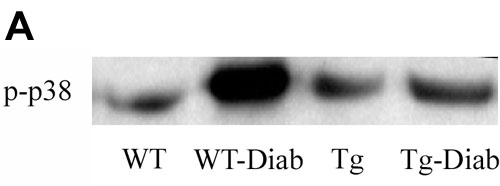
Figure 7. Effect of MnSOD overexpression on diabetes-induced activation of retinal MAP kinase
Activation of MAP kinase was estimated by measuring the expression of phospho-p38 in the same retina as used for H-Ras (A). The retina samples were analyzed in duplicate. The expression of β-actin in each row was used to correct the expression of phospho-p38 MAP kinase. B: The histogram represents the ratio of the densities of p-p38 and β-actin in the same sample (quantified using Un-Scan-It gel software), and the values obtained from WT mice are considered as 100%. Asterisk (*) signifies p<0.05 compared to wild-type (WT) or Tg, and double asterisk (**) indicates p<0.05 compared to WT-Diab.