![]() Figure 6 of
Kowluru, Mol Vis 2007;
13:602-610.
Figure 6 of
Kowluru, Mol Vis 2007;
13:602-610.
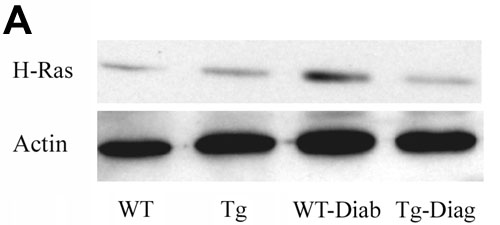
Figure 6. Effect of MnSOD overexpression on diabetes-induced activation of H-Ras in the retina of MnSOD-Tg mice
Activation of H-Ras was estimated in the retina of MnSOD-Tg and wild-type (WT) mice at 3-4 months of diabetes. Each retina sample was analyzed in duplicate, and (A) the Western blots represent five or more mice in each of the four groups. B: The histogram represents the ratio of the densities of H-Ras and β-actin in the same sample (quantified using Un-Scan-It gel software), and the ratio obtained from WT mice is considered to be 100%. Please note that the gel shows that the density of β-actin loading band is about 15-20% higher in diabetes, however, the ratio of the densities of the bands for H-Ras and β-actin in the same sample is about two-fold higher compared to other groups, and the mean H-Ras expression (adjusted to β-actin) obtained from five mice in each group (as depicted in the histogram) is over 1.7 fold higher in WT-diabetes compared to WT-normal mice. WT represents wild-type non diabetic; WT-Diab represents WT-diabetes; Tg represents MnSOD Tg-non diabetic; and Tg-Diab represents MnSOD Tg-diabetes. Asterisk (*) indicates p<0.05 compared to WT or Tg, and double asterisk (**) signifies p<0.05 compared to WT-Diab.