![]() Figure 3 of
Kowluru, Mol Vis 2007;
13:602-610.
Figure 3 of
Kowluru, Mol Vis 2007;
13:602-610.
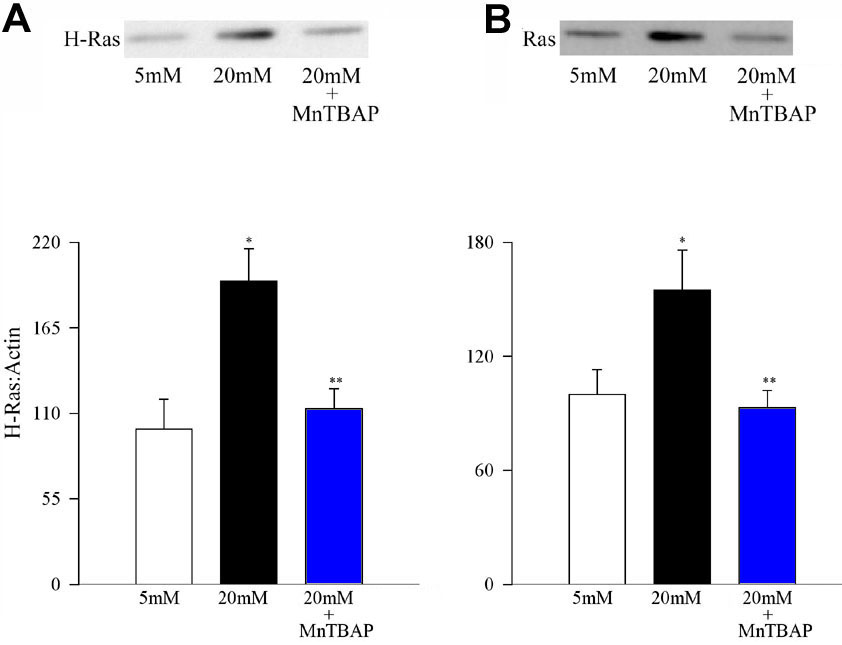
Figure 3. Effect of MnTBAP on glucose-induced activation of H-Ras
Endothelial cells were incubated in 5 mM glucose or 20 mM glucose medium for 96 h in the presence or absence of 200 μM MnTBAP for 96 h. Activation of H-Ras was estimated by (A) Western blot technique and Raf-1 (B) binding assay. Each experiment was repeated with at least three separate cell preparations. The histogram represents the ratio of the densities of H-Ras and β-actin in the same lane as quantified using Un-Scan-It gel software. The values obtained from the cells incubated in 5 mM glucose conditions are considered 100%. Asterisk (*) marks p<0.05 for 5 mM glucose, and double asterisk (**) denotes p<0.05 for 20 mM glucose.