![]() Figure 5 of
Shimazawa, Mol Vis 2007;
13:578-587.
Figure 5 of
Shimazawa, Mol Vis 2007;
13:578-587.
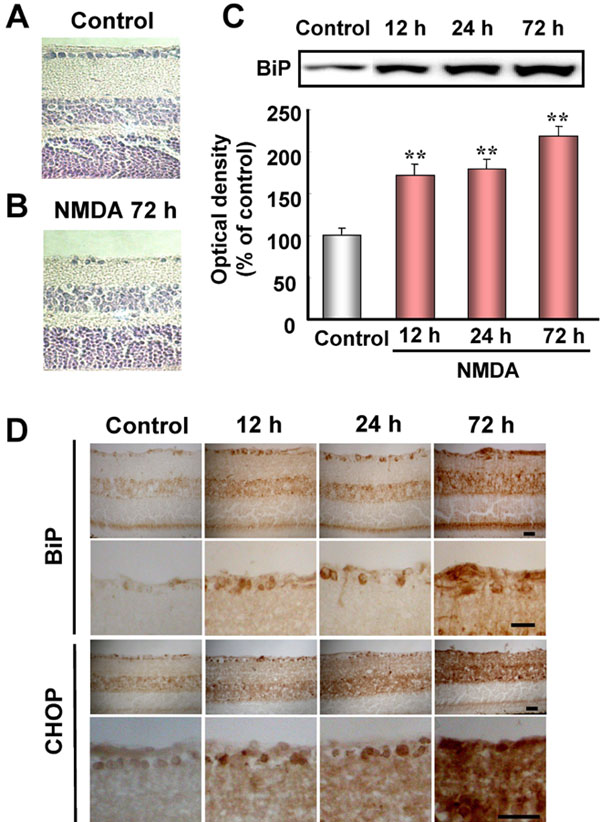
Figure 5. Increases in GRP78/BiP and CHOP in retinal extracts following stimulation by intravitreal injection of N-methyl-D-aspartate (NMDA) in mice
A, B: Representative photographs showing retinal cross-sections stained with hematoxylin and eosin after NMDA injection at 40 nmol/eye. C, upper panel: Representative immunoblots showing the time-course of changes in GRP78/BiP protein levels after intravitreal injection of NMDA. C, lower panel: Quantitative analysis of GRP78/BiP band densities. Data are expressed as mean±SEM (n=6) of values (in arbitrary units) obtained for single band density. Double asterisks represents p<0.01 versus vehicle-treated control group (Dunnett's test). D: Immunostainings for GRP78/BiP and CHOP in mouse retina after NMDA injection at 40 nmol. The scale bar represents 25 μm.