![]() Figure 4 of
Shimazawa, Mol Vis 2007;
13:578-587.
Figure 4 of
Shimazawa, Mol Vis 2007;
13:578-587.
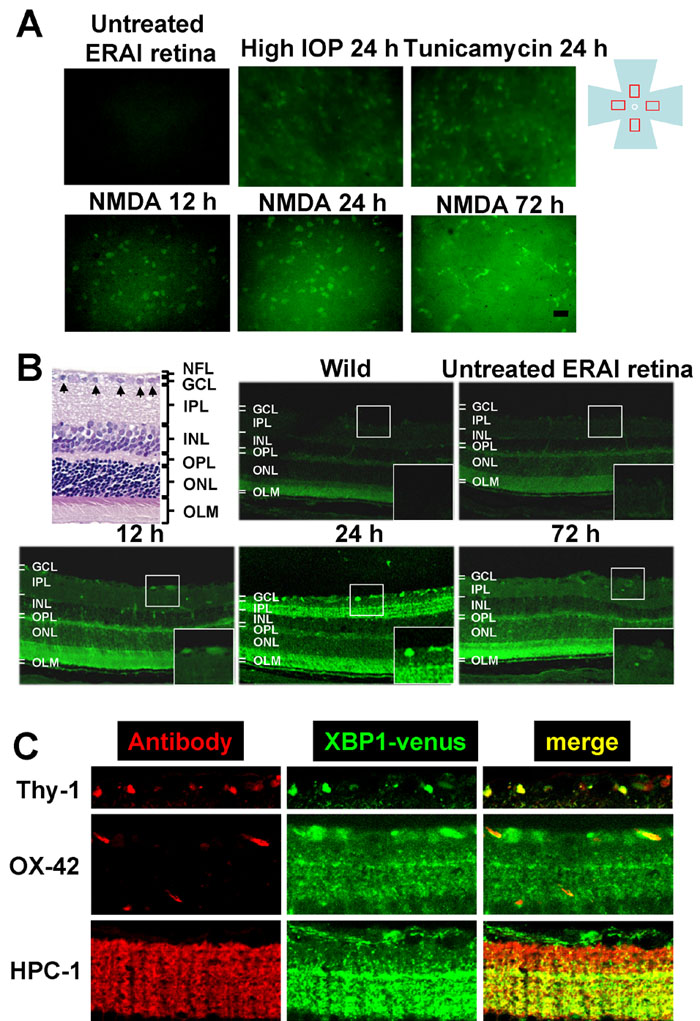
Figure 4. Expression and localization of XBP-1-venus fusion protein in ERAI mouse retinas after various types of retinal damage
A: Representative fluorescence photographs of increased XBP-1-venus fusion protein in ERAI mouse flatmounted retina after N-methyl-D-aspartate (NMDA), intraocular pressure (IOP) elevation, or tunicamycin insult. The fluorescence (green) arising from XBP-1-venus fusion protein was observed under an epifluorescence microscope. The scale bar represents 25 μm. B: Distribution of increased XBP-1-venus fusion protein in retinal cross-sections from ERAI mice after NMDA injection at 40 nmol/eye. The distribution of fluorescence (green) arising from XBP-1-venus fusion protein was observed under a laser confocal microscope. Each large box shows an enlargement of the area within the corresponding small box. C: Localization of XBP-1-venus fusion protein in ERAI mouse retina after NMDA injection. In the retinal nerve fiber layer (upper panels), Thy-1-positive cells (red) can be seen to merge with XBP-1-venus fusion protein (green). In the middle panels, OX-42 (a microglia marker)-positive cells (red) are partly merged with XBP-1-venus fusion protein (green). In the inner plexiform layer (lower panels), HPC-1 (an amacrine marker)-positive cells (red) are merged with XBP-1-venus fusion protein (green).