![]() Figure 2 of
Shimazawa, Mol Vis 2007;
13:578-587.
Figure 2 of
Shimazawa, Mol Vis 2007;
13:578-587.
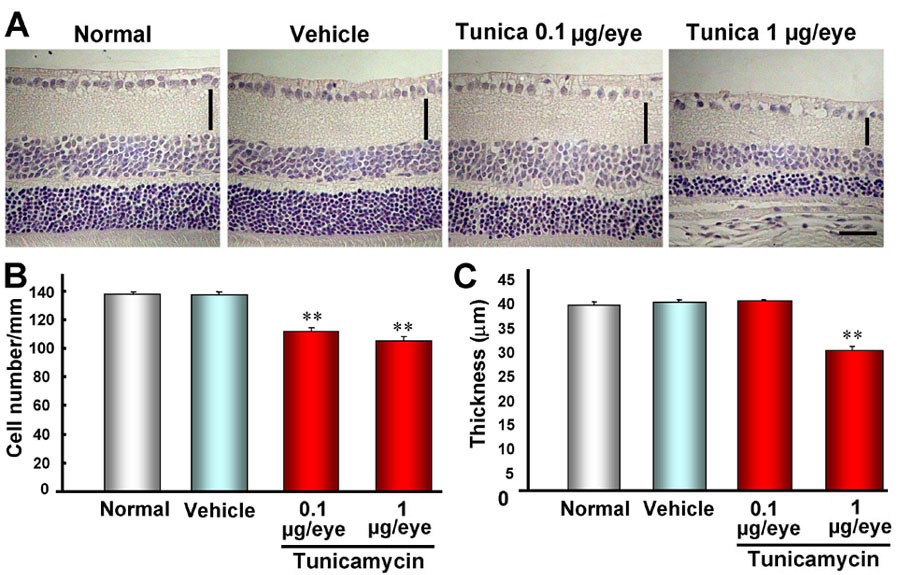
Figure 2. Intravitreal injection of tunicamycin induces retinal cell death in mice
A: Representative photographs showing non-treated normal retina, vehicle-treated retina, and low-dose (0.1 μg/eye) and high-dose (1 μg/eye) tunicamycin-treated retinas 7 days after intravitreal injection. Quantitative analysis of cell number in ganglion cell layer (B) and thickness of inner plexiform layer (IPL) C: Each column represents the mean±SEM (n=10). Double asterisks p<0.01 versus vehicle-treated control group (Dunnett's test). The horizontal scale bar represents 25 μm and the vertical bar indicates each thickness of IPL.