![]() Figure 8 of
Montiani-Ferreira, Mol Vis 2007;
13:553-565.
Figure 8 of
Montiani-Ferreira, Mol Vis 2007;
13:553-565.
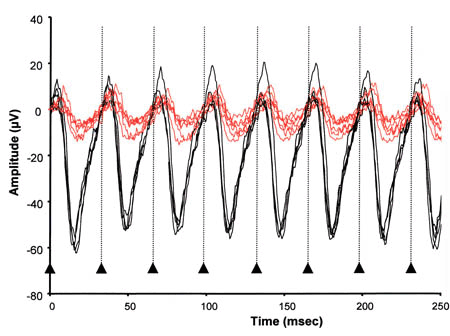
Figure 8. 30 Hz flicker tracings from 1-day-old rge and control chicks
A comparison of 30 Hz flicker tracings of 1-day-old rge chicks (red lines) and control chicks (black lines) at a flash light intensity of 0.4 log cdS/m2 superimposed on a background light of 30 cd/m2. The amplitudes of the responses from the rge chicks are markedly lower than the controls (n=4 control and five rge chicks). Arrowheads with dotted lines indicate flash onset.
