![]() Figure 7 of
Montiani-Ferreira, Mol Vis 2007;
13:553-565.
Figure 7 of
Montiani-Ferreira, Mol Vis 2007;
13:553-565.
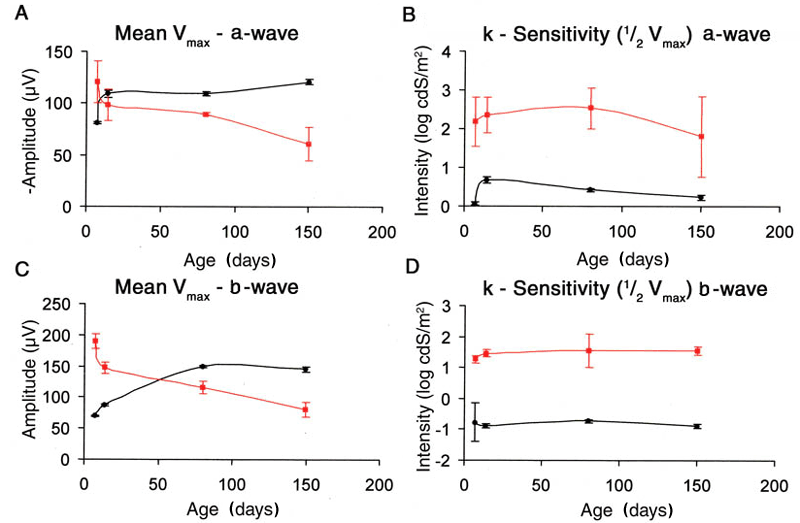
Figure 7. Graphs of mean a- and b-wave Vmax and sensitivity (k) plotted against age
Graphs showing the results for Vmax (A and C) and k (retinal sensitivity, B and D) derived from the Naka-Rushton fits of intensity-response curves. They are shown as mean (1x±SEM) for a-wave (A and B) and b-wave (C and D). The value for a-wave mean Vmax was greater in the 7-day-old rge birds but declined with age. The values for b-wave Vmax were initially greater in the affected compared to the control birds (7 and 28 days old) but decreased with age. The k value of the affected birds was significantly elevated (i.e., the retinas were less sensitive) compared to controls at all ages examined and remained so for the different ages tested. Note that for the a-wave amplitude the amplitudes were multiplied by -1 to make them positive.
