![]() Figure 6 of
Montiani-Ferreira, Mol Vis 2007;
13:553-565.
Figure 6 of
Montiani-Ferreira, Mol Vis 2007;
13:553-565.
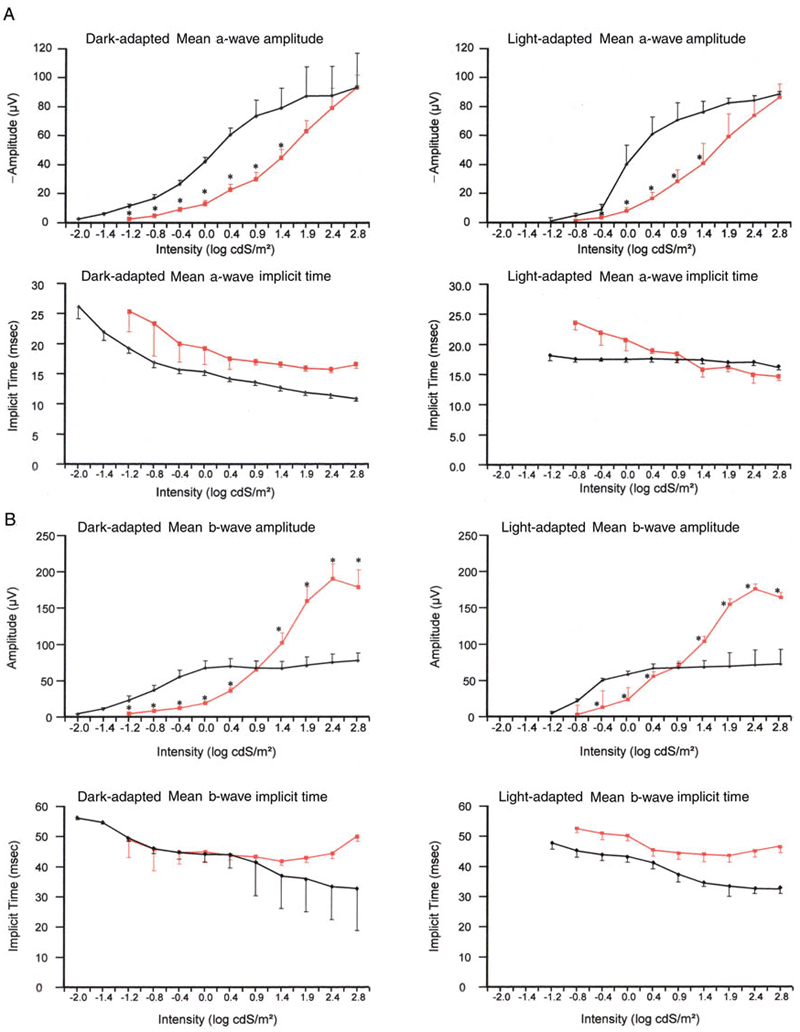
Figure 6. Mean dark- and light-adapted a- and b-wave amplitude and implicit times plotted against flash intensity for 7-day-old rge and control chicks
A: Mean (±SEM) dark-adapted and light-adapted a-wave amplitude and implicit times plotted against flash intensity for 7-day-old rge chicks (red lines) and control chicks (black lines). B: Mean (±SEM) dark-adapted and light-adapted b-wave amplitude and implicit time plotted against flash intensity for 7-day-old rge chicks (red lines) and control chicks (black lines). N=7 control and seven rge birds. Asterisk (*) indicates that the amplitude of the rge birds was significantly different from the control birds. A p<0.05 was considered significant.
