![]() Figure 5 of
Montiani-Ferreira, Mol Vis 2007;
13:553-565.
Figure 5 of
Montiani-Ferreira, Mol Vis 2007;
13:553-565.
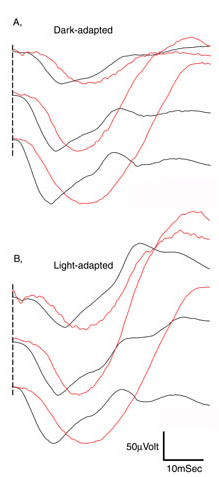
Figure 5. Comparison of normalized a-waves from dark-adapted and light-adapted rge and control birds
Comparison of normalized a-wave response from dark-adapted (A) and light-adapted (B) rge (red tracings) and control (black tracings) birds. The waveforms represent the averaged waveforms from eight rge and eight control birds aged 13-22 days old. For each comparison the averaged waveforms from the rge birds were normalized to the peak amplitude of the mean control bird a-wave. Flash intensities from top were 0.39, 1.36, and 2.39 log cdS/m2. Horizontal bar is 10 mSec. Vertical bar of 50 μV refers only to the control waveforms, since the waveforms of the mutant birds were normalized. Initiation of the a-wave down slope was delayed, the initial portion of the leading slope was less steep, and the implicit time was increased in the rge birds compared to the controls.
