![]() Figure 4 of
Montiani-Ferreira, Mol Vis 2007;
13:553-565.
Figure 4 of
Montiani-Ferreira, Mol Vis 2007;
13:553-565.
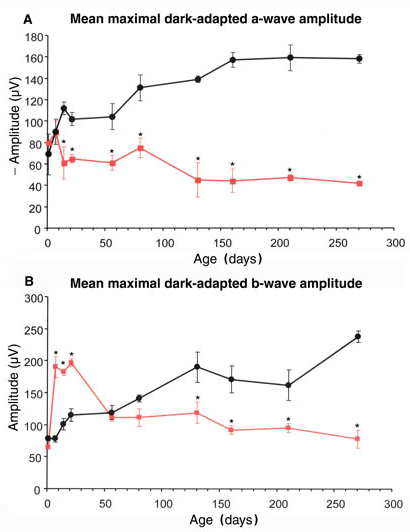
Figure 4. Mean maximal dark-adapted a- and b-wave plotted against age
Mean (1x±SEM) dark-adapted maximal a-wave (A) and b-wave (B) recorded from rge (red lines) and control birds (black lines). A: After an initial increase in maximal a-wave between one and seven days of age, the a-wave amplitude in the rge group decreased by 14 days of age. It remained fairly constant for the rest of the ages investigated, whereas that of control birds increased further with age. B: The rge birds had a supernormal maximal b-wave from 7 to 28 days of age followed by a decrease in amplitude with increasing age. n=6 control and five rge birds; asterisk (*) indicates the amplitude of the rge birds was significantly different from the control birds. A p<0.05 was considered significant.
