![]() Figure 3 of
Montiani-Ferreira, Mol Vis 2007;
13:553-565.
Figure 3 of
Montiani-Ferreira, Mol Vis 2007;
13:553-565.
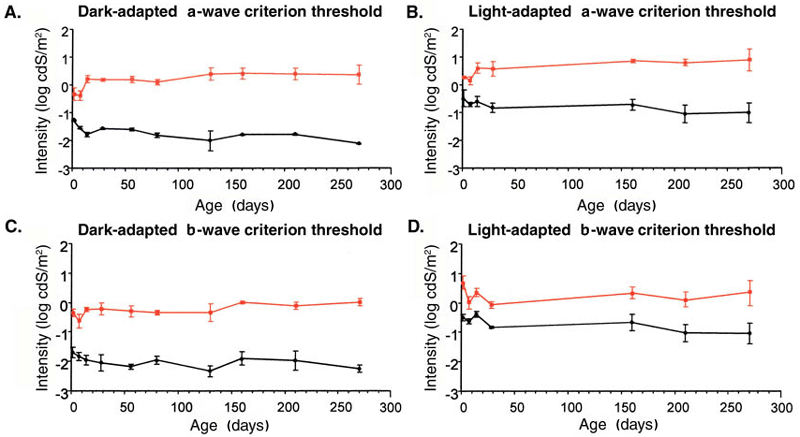
Figure 3. Mean flash intensity required to elicit a 5 μV criterion response threshold response (±1 SEM) plotted against age
A and B show a-wave thresholds for dark-adapted and light-adapted birds, respectively. C and D present b-wave thresholds for dark-adapted and light-adapted birds, respectively. Black lines represent control birds, and red lines represents rge birds. In the control birds the response thresholds decreased slightly over the first few weeks of life then plateaued. The thresholds of the rge birds were elevated, but they also decreased slightly from one to seven days of age, increased at 14 days of age, then remained similar over the time period of the study. n is between three and seven birds at each age.
