![]() Figure 1 of
Montiani-Ferreira, Mol Vis 2007;
13:553-565.
Figure 1 of
Montiani-Ferreira, Mol Vis 2007;
13:553-565.
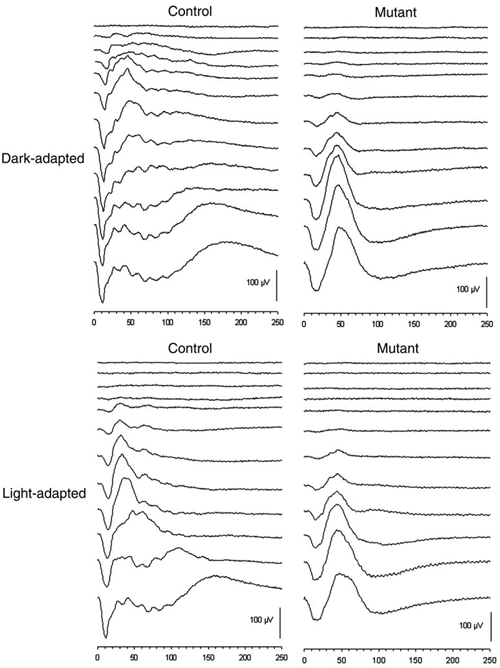
Figure 1. Representative dark-adapted and light-adapted electroretinogram recordings from a control chick and an rge (mutant) chick aged seven days
The rge chick had an elevated response threshold for both dark-adapted and light-adapted waveforms. The shape of the rge electroretinogram waveform was quite different from that taken of the control chick. The a-wave slope is less steep than that of the normal chick and the a-wave implicit time increased. The b-wave is smoother due to the lack of oscillatory potentials and is greater in amplitude than that of the control bird at the brighter flash intensities. Flash intensities from top to bottom were as follows: -2.4, -2.0, -1.42, -1.19, -0.79, -0.39, 0.00, 0.39, 0.85, 1.4, 2.3, and 2.9 log cdS/m2. Vertical bar represents 100 μV; X-axis is time in mSec.
