![]() Figure 1 of
Yoshida, Mol Vis 2007;
13:545-548.
Figure 1 of
Yoshida, Mol Vis 2007;
13:545-548.
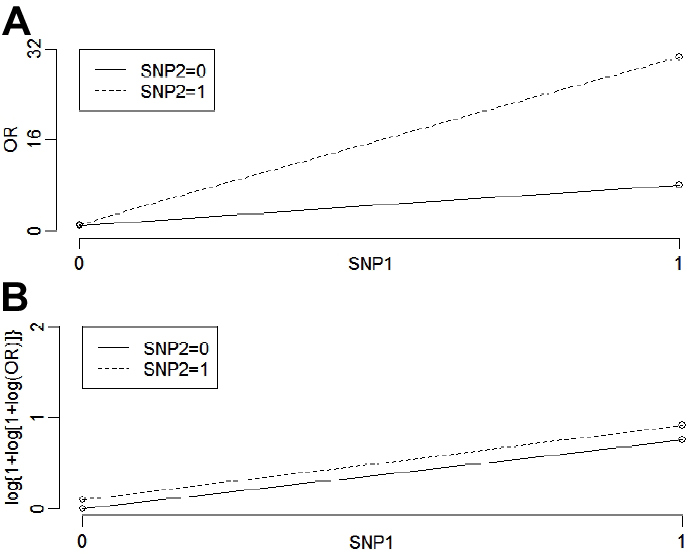
Figure 1. Odds ratio plots for two single nucleotide polymorphisms
Joint odds ratio plots for the single nucleotide polymorphisms (SNPs), complement factor H (CFH) 402, and rs11200638 before and after log transformation showing that the apparent interaction is a "removable" effect. SNP1=CFH 402: 0 is for TT and 1 is for CT; SNP2=rs11200638: 0 is for GG/GA and 1 is for AA. A: Original odds ratio (OR) curves: Height difference on the left is 1.11-1=0.11; height difference on the right is 30.52-7.92=22.60; slope for SNP2=0 is 7.92-1=6.92; slope for SNP2=1 is 30.52-1.11=29.41. B: Log(1+log(1+log)) transformation of the original OR.
