![]() Figure 2 of
Ziebarth, Mol Vis 2007;
13:504-510.
Figure 2 of
Ziebarth, Mol Vis 2007;
13:504-510.
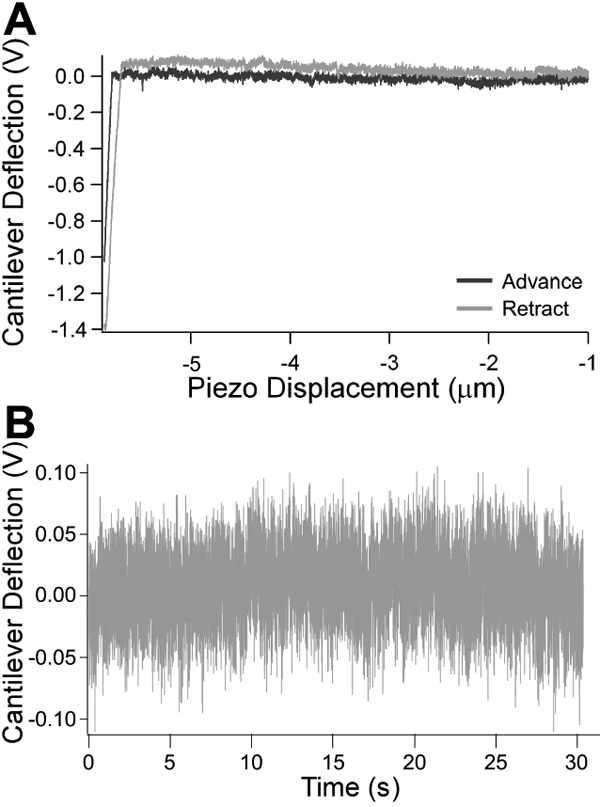
Figure 2. Calibration scans performed to characterize the atomic force microscope cantilever
A: Force scan conducted on a hard surface to determine voltage-deflection relationship. A force scan was conducted on the surface of the Petri dish with no sample to determine the relationship between voltage detected at the photodiode and cantilever deflection. The curve provides the voltage-displacement curve in the absence of indentation. This response is used in the calculation of the force-indentation curves obtained on a samples. B: Recording of natural vibrational frequency of cantilever in fluid. The thermally induced cantilever fluctuations are measured by recording the vibrational frequency of the cantilever in fluid. This response is used to measure the spring constant using equation 1.
