![]() Figure 3 of
Rose, Mol Vis 2007;
13:497-503.
Figure 3 of
Rose, Mol Vis 2007;
13:497-503.
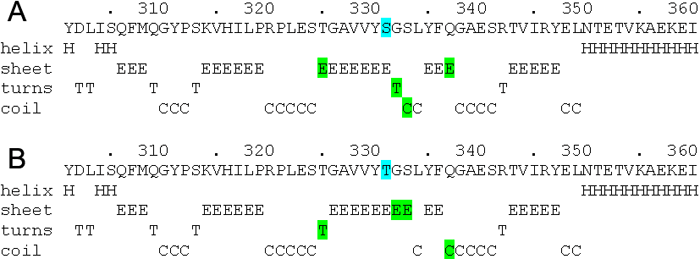
Figure 3. Secondary structure prediction of the mutant sequence (Ser331Thr) using the GOR method
Comparison between the predicted secondary structures of control (A) amino acid sequences of myocilin and the amino acid sequences of myocilin with the Ser331Thr variant (B; only the region where there was a change in the predicted secondary structure has been shown).