![]() Figure 2 of
Wu, Mol Vis 2007;
13:493-496.
Figure 2 of
Wu, Mol Vis 2007;
13:493-496.
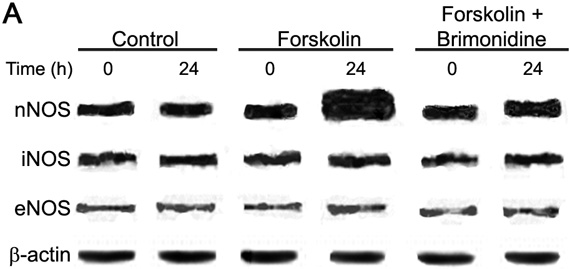
Figure 2. Protein expression of three NOS isoforms (nNOS, iNOS, and eNOS) in human ciliary bodies
Western blot analysis of NOS proteins are shown in A. Each experiment was repeated 3 times and the mean values of the results of these experiments are shown in B. The asterisk denotes a p<0.01, versus forskolin (0 h) and the double asterisk indicates a p<0.05, versus forskolin (24 h).