![]() Figure 8 of
Robertson, Mol Vis 2007;
13:457-469.
Figure 8 of
Robertson, Mol Vis 2007;
13:457-469.
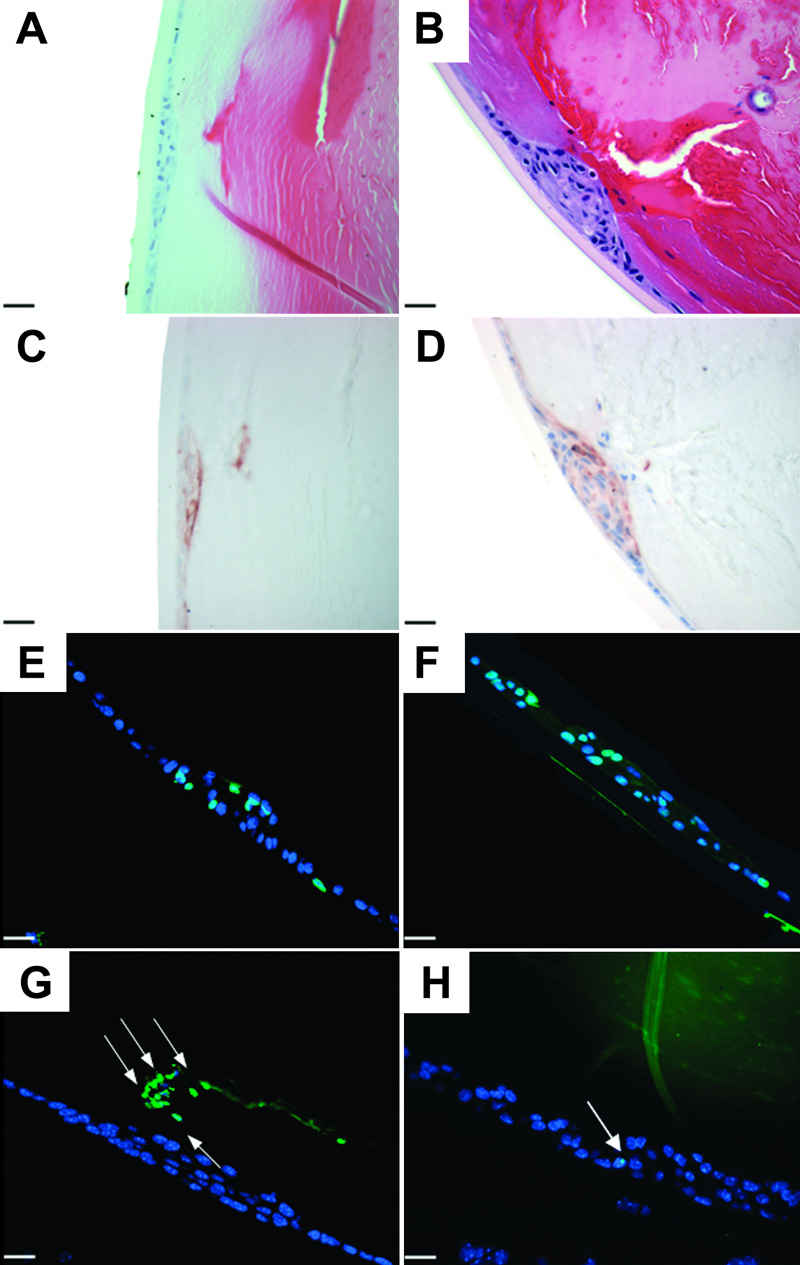
Figure 8. Effects of adenoviral gene transfer of active TGFβ1 to Smad3KO eyes after four days.
Histological sections from Smad3KO (A, C, E, and G) and WT (B, D, F, and H) treated with AdTGFβ1. Both groups developed αSMA (brown; C and D) expressing plaques, and showed no difference in cellular proliferation by the PCNA (green) stain (E and F). Smad3 KO (G) animals demonstrated more TUNEL (green) positive cells (arrows) compared to WT (H). The scale bar is equal to 25 μm.