![]() Figure 6 of
Ronkko, Mol Vis 2007;
13:408-417.
Figure 6 of
Ronkko, Mol Vis 2007;
13:408-417.
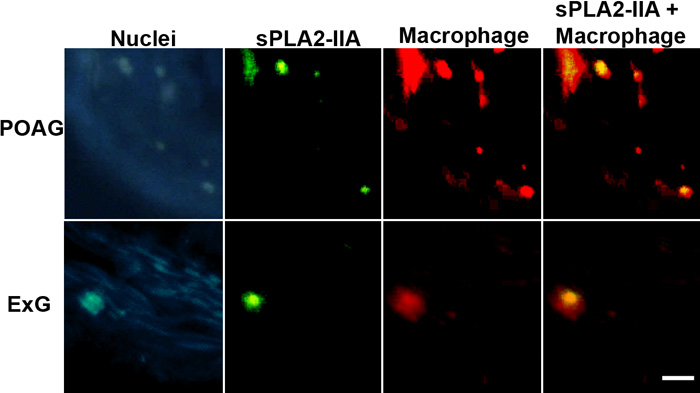
Figure 6. Colocalization of sPLA2-IIA and macrophages in POAG and ExG
The first column shows nuclear staining (far red shown in blue) with SYTO 62. The second column shows sPLA2-IIA staining (green), and the third column shows macrophages (red). Combined image (sPLA2-IIA + macrophage) in the fourth column shows the colocalization of sPLA2-IIA and macrophage (yellow). The scale bar is equal to 50 μm.