Figure 5 of Ronkko, Mol Vis 2007; 13:408-417.
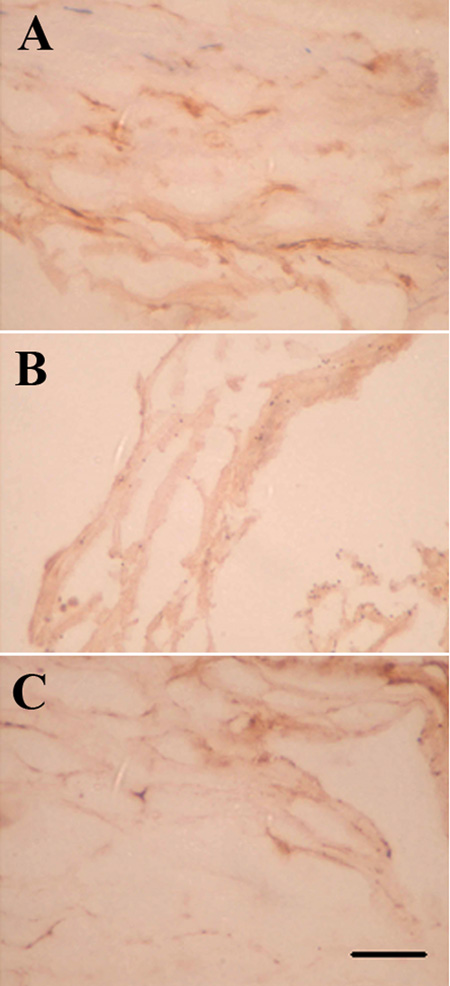
Figure 5. Immunostaining of macrophages
The number of macrophages is increased in POAG (A) when compared to ExG (B) or control samples (C). The scale bar is equal to 50 μm.