![]() Figure 4 of
Ronkko, Mol Vis 2007;
13:408-417.
Figure 4 of
Ronkko, Mol Vis 2007;
13:408-417.
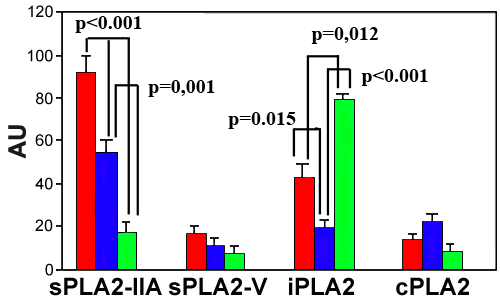
Figure 4. Photoshop-based image analysis of sPLA2-IIA, PLA2-V, iPLA2, and cPLA2 levels in TM
Cryostat sections were obtained from POAG patients (red bars), ExG patients (blue bars), or from healthy donor eyes (green bars). The results are mean (arbitrary units)±SEM of six POAG patients, six ExG patients or three healthy donor eyes. Each set of experiments was performed in triplicate.
