![]() Figure 3 of
Ronkko, Mol Vis 2007;
13:408-417.
Figure 3 of
Ronkko, Mol Vis 2007;
13:408-417.
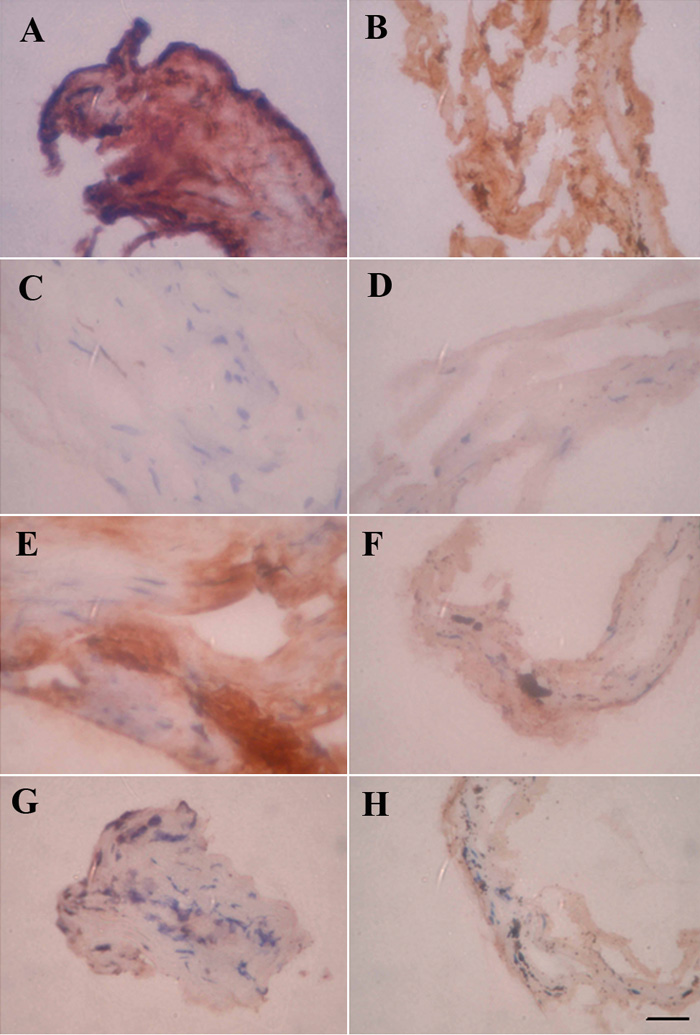
Figure 3. Immunostaining for PLA2s in POAG and ExG
Immunoreaction for sPLA2-IIA is heavier in POAG (A) compared to ExG (B). In trabecular meshwork tissue, immunoreactivity was found near the stained macrophages. PLA2-V staining was weak in POAG (C) and ExG (D). In POAG (E) trabecular meshwork staining for iPLA2 is near positively stained macrophages. In ExG samples (F) iPLA2 staining is in macrophages. Cellular staining of cPLA2 was low in POAG (G) and ExG (H) samples. The scale bar was equal to 50 μm.