![]() Figure 6 of
Chen, Mol Vis 2007;
13:374-387.
Figure 6 of
Chen, Mol Vis 2007;
13:374-387.
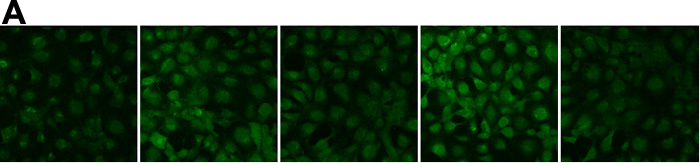
Figure 6. Confocal images of intracellular ROS generation upon PDGF stimulation in live Ras or Rac transfected cells
Serum starved transiently transfected cells were preloaded with DCFDA (50 μM) to capture the ROS generated upon PDGF (1 ng/ml) stimulation. Confocal cell images represent a random field after PDGF exposure. For details see Methods. A: Panels from left to right are: Negative control cells (vector transfected, no PDGF); positive control cells (vector transfected, with PDGF), dominant negative Rac transfected cells (Rac N17, with PDGF), constitutively active Rac tansfected cells (Rac V12, with PDGF), and dominant negative Ras transfected cells (Ras N17, with PDGF). B: Bar graph corresponding to the confocal images in A. The DCF fluorescent intensity was quantified using Confocal Assistant 4.02, and expressed as precent increase normalized to control (100%). The data are expressed as mean±SD with n=3. Each p value was obtained by using mutant transfectant against vector trasnfectant (with PDGF). The asterisk indicates a p<2x10⁻⁵ and the double asterisk denotes a p<0.03.