![]() Figure 1 of
Chen, Mol Vis 2007;
13:374-387.
Figure 1 of
Chen, Mol Vis 2007;
13:374-387.
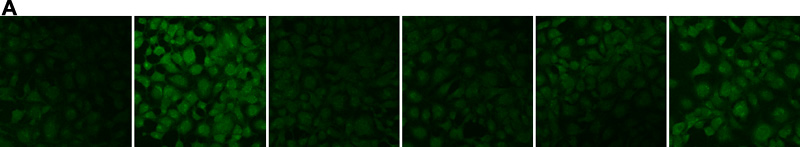
Figure 1. Confocal images of intracellular ROS generation upon platelet-derived growth factor (PDGF) stimulation in live HLE B3 cells
Live HLE B3 cells were preloaded with DCFDA (50 μM) to capture the ROS generated upon PDGF (1 ng/ml) stimulation. Confocal cell images represent a random field after PDGF exposure. For further details see Methods. A: Panels from left to right in following conditions: control cells (no PDGF); control cells (with PDGF); PDGF-stimulated cells pretreated with PDGF receptor inhibitor, AG1296 (20 μM, 30 min); PDGF-stimulated cells pretreated with Src inhibitor, PP1 (10 μM, 30 min); PDGF-stimulated cells pretreated with PI3K inhibitor, LY294002 (15 μM, 30 min); and PDGF-stimulated cells pretreated with inhibitor to G-protein coupled receptor, pertussis toxin or Ptx (500 ng/ml, 1 h). B: Bar graph corresponding to the confocal images in A. The DCF fluorescent intensity was quantified using Confocal Assistant 4.02, and expressed as percent increase normalized to control (100%). The data are expressed as mean±SD with n=3. Each p value was obtained by using inhibitor against control (with PDGF). The asterisk indicates a p<8x10⁻⁵.