![]() Figure 4 of
Zhang, Mol Vis 2007;
13:330-336.
Figure 4 of
Zhang, Mol Vis 2007;
13:330-336.
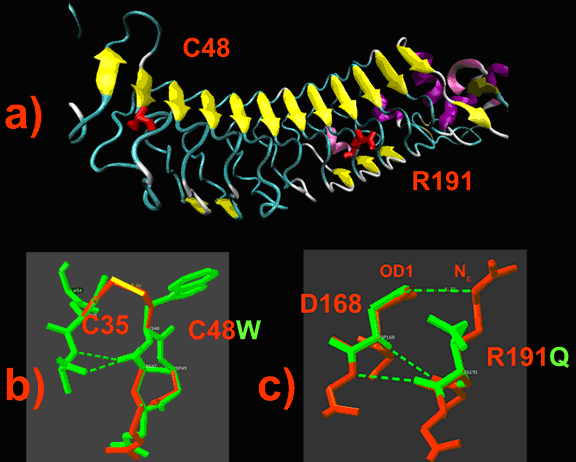
Figure 4. Structural model of nyctalopin built by homology modeling and effect of genetic mutations
A: 3-Dimensional structure of nyctalopin. Yellow arrows show beta-strands. The side chains of C48 and R191 are shown in red. B: Detail of the region surrounding the C48W mutation showing disruption of disulfide bonds. C: Detail of the effect of the R191Q mutation showing loss of hydrogen bonds. The normal and mutated nyctalopin structures are shown in red and green, respectively. Hydrogen and disulphide bonds are shown by green dashed and yellow solid lines, respectively.
